Vulnerability Exploitation in the Wild
A look at the inaugural study of EPSS Data and Performance as published by Cyentia/FIRST
Welcome to Resilient Cyber, in this article we will be discussing the latest EPSS Data and Performance Study.
Interested in sponsoring an issue of Resilient Cyber?
This includes reaching over 6,000 subscribers, ranging from Developers, Engineers, Architects, CISO’s/Security Leaders and Business Executives
Reach out below!
If you’ve been following me for any time, you know I’m a proponent of the Exploit Prediction Scoring System (EPSS), as part of a broader push to modernize the way we do vulnerability management.
This is due to the fact that legacy approaches, such as primarily using Common Vulnerability Scoring System (CVSS) scores is severely flawed, ineffective and wasteful. The reasoning is that only 5-6% of all vulnerabilities ever reported (e.g. as CVE’s) are actually ever known to be exploited in the wild. Meaning, most organizations waste tremendous time and resources, of which are finite, on chasing down vulnerabilities that never get exploited.
Cyentia and FIRST (the latter is the same organization that manages CVSS), published the first ever study of EPSS data and performance, fully titled “A Visual Exploration of Exploitation in the Wild: The Inaugural Study of EPSS Data and Performance”.
It is an awesome report, full of data-driven insights on the vulnerability landscape and amazing visualizations to quickly and simply communicate the data - so we will be discussing it in this article.
What is EPSS?
First off, for those not familiar with EPSS, we can provide a quick summary.
The official definition is:
The Exploit Prediction Scoring System (EPSS) is a data-driven effort for estimating the likelihood (probability) that a software vulnerability will be exploited in the wild.
It provides a probability score between 0 and 1 (e.g. 0 and 100%) that a vulnerability will be exploited. Scores are generated daily for all CVE’s and reflect a 30 day window ahead in terms of exploitation probability.
I’ve published several articles on EPSS, such as:
With that out of the way, let’s dive into the Cyentia/FIRST EPSS Study to see how it truly performs using real-world data.
The report discussing a broad range of topics, such as:
The growth of vulnerabilities and correlation with exploitation rates
Exploitation activity over time
New vs. old exploitation
Looking at EPSS’ performance both in isolation and compared with CVSS and CISA KEV
Cybersecurity Meets Pragmatism
One refreshing aspect of the EPSS study is that in a world of cyber where all we hear is outlandish claims, ridiculous metrics, and false promises, the EPSS study openly embraces reality.
They do this with statements such as:
“EPSS is not perfect. It will rate some vulnerabilities very low that end up with exploitation activity, and some very heigh that don’t. However, perfection isn’t an option for anyone in reality"
Total Vulnerabilities Published & Exploited
The first portion of the study takes a look at the total number of vulnerabilities published (as Common Vulnerabilities and Enumerations (CVE)’s in NIST’s National Vulnerability Database (NVD)) and how many of them have been exploited.
As the study points out, and as I have discussed before, we are seeing tremendous double digital growth of vulnerabilities Year-over-Year (YoY).
They provide additional diagrams showing that annual CVE totals continue to climb too, with 2024 being the first year to exceed (easily) 30,000 CVE’s in a single year. The study points out the average YoY growth is 16%.
As I have discussed in articles such as:
We know that not only is the overall total of vulnerabilities YoY being published growing, but so are organizations vulnerability backlogs, and attackers focus on vulnerability exploitation as a leading cause of security data breaches.
To put it simply, we’re target rich.
Organizations can’t keep up with the number of vulnerabilities in their environments, for a myriad of reasons, such as explosive vulnerability growth, resource shortages, gaps in visibility, challenges with buy-in from engineering, development and business peers and more.
The problem is only going to get worse as software becomes more pervasive, GenAI accelerates code development cycles and vulnerability research and discovery accelerates.
This emphasizes the need to focus on what is actually relevant (e.g. known exploitation, exploitation probability, reachable/exploitable, business critical and so on).
How many CVE’s actually get exploited?
Now that we know organizations can’t keep up, and that focusing on vulnerabilities that are actually known or likely to be exploited should be a key part of your vulnerability management strategy, how many are historically known to be exploited?
The study points out that the figure is approach 15,000. That may sound like a lot, but you have to keep in mind that is out of nearly 250,000 known vulnerabilities.
As they show, that means overall, we see about just 6% of ALL known vulnerabilities ever get exploited.
Now stop and think for a moment about how many organizational resources across the entire cybersecurity ecosystem are absolutely wasted focusing on the 94% of vulnerabilities that weren’t known to be exploited, and never ended up getting exploited, as well as all of the back and forth, churn, toil, frustration and resentment we’ve fostered with Development, Engineering and Business peers making them chase down and spend time and energy on things that ultimately never presented any risk to the business.
The study goes on to show that much like the weather, or a river, vulnerability exploitation ebbs and flows or comes and goes.
The EPSS study states that how organizations approach this fluctuation will vary, depending on risk tolerance. Some organizations may focus on all vulnerabilities with any ever known exploitation, while others may focus on those recently exploited, or most likely to be exploited in the near future.
Knowing organizations are struggling to keep pace, the latter approach may make sense but this will vary depending on the organizations size, complexity, resources, expertise, tooling and regulatory requirements of course.
Exploitation Patterns
Much like the fluctuating behavior of the number of CVE’s with exploitation activity in a given year, exploitation activity varies widely by both the specific CVE as well as the time of week, month and year.
While the EPSS study doesn’t didn’t disclose which specific CVE’s it is look at in the above visualization, I would suspect this behavior is influenced by how pervasive a specific vendor/product is, how much early success the attackers have with exploiting victims and more, all of which may contribute to how often and how long they continue to try exploiting a specific CVE.
It is more much likely that a widely pervasive dominant product which they had success exploiting early on and is still widely present and un-remediated will lead to continued exploitation attempts.
Attackers Love Vintage Vulnerabilities
One really informative insight from the report that I wanted to highlight is they point out that despite all the hype and buzz about the latest “zero day” and vulnerability in the headlines, attackers are taking advantage of existing known vulnerabilities.
Below is an excerpt from the report highlighting this reality:
So despite all the media and industry hype around the latest flashy zero day vulnerability, the majority of vulnerabilities being exploited are vulnerabilities that are being observed as exploited in a given but and previously exploited as well.
When you reflect back to our previous comment about the massive vulnerability backlogs organizations have, it makes sense that organizations would continue to target known and known exploited vulnerabilities - why change your tactics for the latest fancy zero day, when tons of known exploited vulnerabilities are sitting around ripe for the picking.
Another interesting insight is the “last observed” aspect of exploited vulnerabilities. As they break down in the study:
50% of the 14,000 known exploited vulnerabilities have exploitation activity within the past week
25% have been attacked in the last 12 months
The remaining 25% have been dormant or have no exploitation activity in over a year
This makes sense, given attackers likely move on as they begin to experience diminishing ROI on attacking specific vulnerabilities, organizations have largely patched a specific vulnerability and/or specific software and products are not any long as prevalent.
This means organizations should be using this insight from EPSS to help drive their vulnerability prioritization efforts even further, focusing on both vulnerabilities relevant to their enterprise and attack surface and also those with recently seen exploitation activity.
They also provide insights into how quickly vulnerabilities get exploited after being first published/observed. I recently shared a report from Cloudflare that stated attackers are attempting to exploit some CVE’s as quickly as 22 minutes after a Proof-of-Concept exploit is made available.
While that may be true, the data from the EPSS study shows that isn’t always the case, and exploitation activity happens on a spectrum.
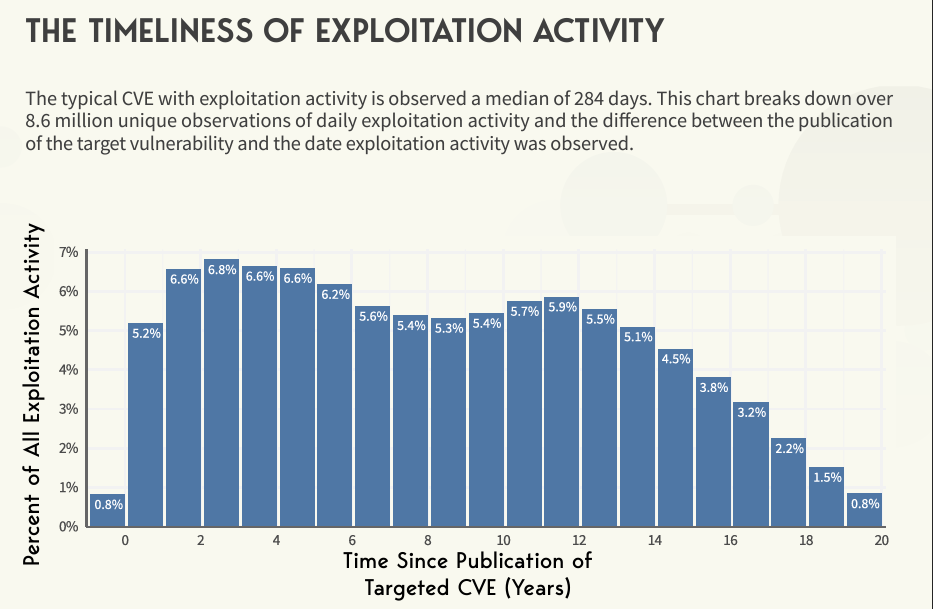
Age of Exploitation Activity
First, let’s acknowledge the humor of the EPSS Study authors. There’s a saying “Beatings will Continue until Morale Improves”, they snuck in a similar quote:
“Hackings will continue until security improves”
While funny, this is also demoralizing because well, it can be argued security may not be improving, at least not at the pace that exploitation is.
So they took a look at how old CVE’s are when they get targeted for exploitation. What they found was a fairly broad range showing that attackers not only may target new shiny vulnerabilities but years/decades old vulnerabilities as long as they are present and welcoming.
Attackers are equal opportunity exploiters.
These metrics of course should be concern given we know most organizations have vast amounts of legacy technologies, infrastructure and technical debt. All of the legacy infrastructure and software is still vulnerable, and as demonstrated, is still being targeted for exploitation.
This problem exists within open source (and products containing open source) as well, with reports such as Synopsys’ Open Source Security and Risk Analysis Report finding:
14% of codebases contain vulnerabilities older than 10 years old
2.8 years being the mean age of vulnerabilities in codebases
49% of codebases having no new development activity in 24 months
91% of codebases containing components that are 10 or more versions behind the current version
I dug into these in an article titled “Open Source Security Landscape 2024”.
How Does EPSS Actually Perform?
Now that we’ve discussed the threat and vulnerability landscape using the study, let’s take a look at the highlights from the study with regard to EPSS’ actual performance, which is what many are interested in.
Organizations historically rely heavily on CVSS, and more recently KEV, so new entrants gaining traction such as EPSS are viewed with skepticism by some (rightfully so), so looking at its actual performance, both in isolation and when compared to other leading prioritization schemes is key.
This section of the study opens with a recap of how EPSS works, and while I won’t belabor the point here, it is worth going to read that section of the paper to better understand.
CVSS
To put it bluntly, EPSS far outperforms alternatives like CVSS and prioritizing all “High” and “Critical” vulnerabilities, as seen in the picture below, due to the fact that a massive amount of time is wasted chasing down and remediating vulnerabilities that are never exploited and pose insignificant risk.
CISA Known Exploited Vulnerability (KEV)
Another leading source of vulnerability intelligence, especially in the public sector is the CISA KEV. The study shows that EPSS identifies many vulnerabilities with observed exploitation that didn’t make it onto the KEV, but ALSO shows some CVE’s on KEV weren’t picked up by EPSS - meaning both should be used when looking to prioritize vulnerabilities with known or likely exploitation activity.
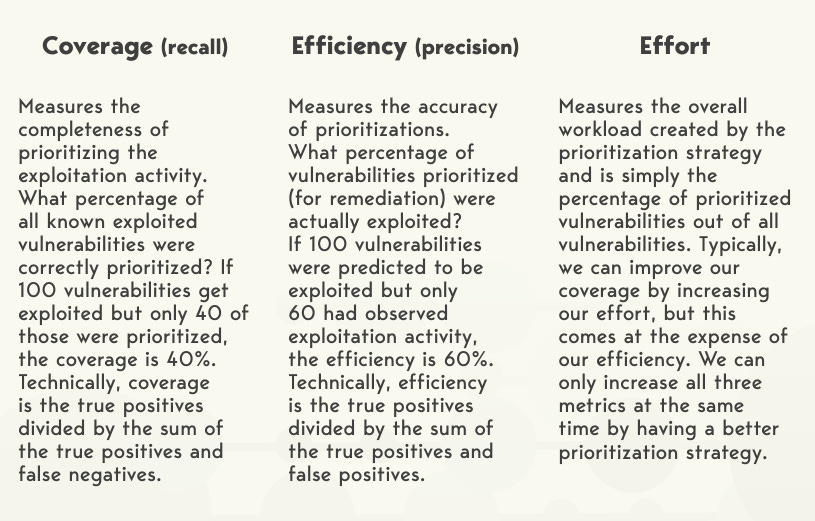
Before we look at the specifics of EPSS performance that the study highlights we need to cover three core terms they rally around, so that the data makes sense.
With these three things in mind (e.g. coverage of total known exploited vulns, % of prioritized vulns that actually got exploited and then effort/workload)we can take a look at the performance of EPSS.
Remember, EPSS produces a probability score (0-1.0) that a vulnerability will be exploited in the next 30 days, and that score is re-produced daily.
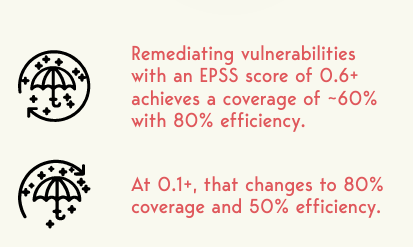
So while no vulnerability prioritization scheme is flawless, it is clear that EPSS Version 3 (the latest version) scores very well when it comes to both Efficiency and Coverage, especially depending on the EPSS threshold you set for prioritization, which organizations can tailor based on their risk tolerance.
Next up they discuss EPSS’ effectiveness compared to CVSS, which most organizations currently use for vulnerability prioritization and remediation.
Now, many organizations may be wondering what EPSS threshold they should use, or where to start. The EPSS study provided some valuable recommendations on this front.
Conclusion
First off, if you’re interested in EPSS, be sure to go read the paper, it is incredibly detailed, thorough and fair, which is rare in security when competing interests may be at play between products, companies, organizations and projects.
Secondly, it is clear that while EPSS is far from perfect, on its own, it represents an exponential improvement in terms of efficiency when it comes to prioritizing vulnerabilities for remediation and when doing it with finite time and resources, a challenge all organizations regardless of size, capability and budget suffer from.
Couple that with the reality we have discussed that most organizations have vulnerability backlogs in the hundreds of thousands to millions and the need to optimizing our efficiency when it comes to vulnerability prioritization is absolutely key.
That said, as the EPSS study itself says, EPSS doesn’t have to be, and shouldn’t be used in isolation. When coupled with additional organizational context such as asset criticality, data sensitivity, internet accessibility, reachability analysis, compensating controls and more it represents a tremendously improved approach to vulnerability management. When coupling the above with additional sources of known exploitation such as CISA KEV, the performance is bolstered even further.
The pace of vulnerabilities is only poised to accelerate due to factors such as:
Further proliferation of software into every aspect of society
AI-driven code generation tools
Improved vulnerability research and discloser
We also know the cybersecurity workforce challenge is ever-present, also contributing to remediation challenges, in addition to many other factors. Verizon’s DBIR emphasized the role vulnerability exploitation is playing in security incidents, and is a growing trend, coupled with other reports such as Mandiant’s M-Trend report.
For these reasons and more, effective vulnerability prioritization is absolutely fundamental for organizations reducing their critical risks.
I discuss these topics, including detailed discussions around EPSS and more in much more depth in my book “Effective Vulnerability Management: Managing Risk in the Vulnerable Digital Ecosystem” which can be found on Amazon.


