
The Perimeter Problem Won't Go Away
A look at Intruder's 2026 Attack Surface Management Index

While the industry obsesses over AI-generated exploits and autonomous attack chains, the 2026 Attack Surface Management Index from Intruder tells a more uncomfortable story.
The perimeter problems that organizations have been ignoring for years haven’t gone away, and the data on who is actually fixing them and how fast reveals structural gaps that no amount of AI hype addresses. Across thousands of organizations and the 12 months leading up to March 2026, the report analyzed real-world attack surface data to measure what’s exposed, how long it stays exposed, and which organizations are doing something about it.
This is the third piece I’ve written in collaboration with the Intruder team, following my analysis of the 2025 Exposure Management Index and the Security Middle Child report, and the throughline across all three is consistent. The data keeps revealing the same structural pattern. Organizations know what’s exposed and they know what needs to be fixed. The gap is in the operational capacity to actually do it, and that gap widens predictably based on organization size, industry, and the maturity of the security program and AI is exacerbating all of the existing challenges, as the rate of vulnerability discovery and exploitation continues to collapse.

What’s Actually Exposed
The report’s attack surface exposure data confirms what most practitioners already suspect but rarely have the aggregate data to prove. 60% of organizations had exposed HTTP admin panels, with WordPress Admin and phpMyAdmin leading the list. 49% had exposed ports and services, with Remote Desktop, SNMP, and UPnP among the most common. 42% had exposed databases, with MySQL and Postgres dominating, and 30% had exposed files and information, including API documentation, web.config files, and Apache configuration files.
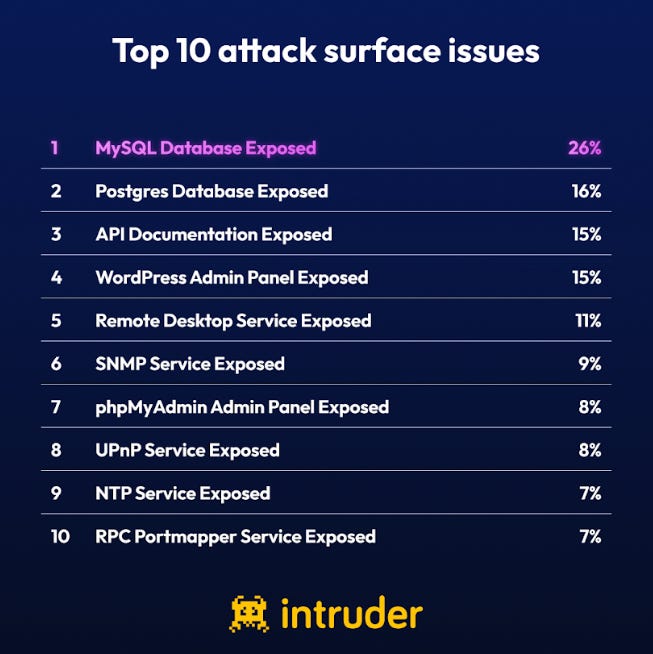
The top 10 most common attack surface issues tell a story that should make every security team reflect on the effectiveness of their activities. Over a quarter of organizations, 26%, have an exposed MySQL database. One in six have an exposed Postgres database and more than one in seven have exposed API documentation, which ranked ahead of Remote Desktop in prevalence. These aren’t sophisticated misconfigurations buried deep in complex architectures. They’re basic exposure issues that have been well-understood for years, and they persist at scale because the incentive structure doesn’t force organizations to address them until something goes wrong. This of course is the longstanding bolting on rather than building in of security that we all painfully know so well.
The exposed API documentation finding is one that jumped out to me. Exposed Swagger or API docs give an attacker a complete roadmap to the backend, every endpoint, every parameter, every authentication requirement laid out in structured, machine-readable format. In a world where AI-powered reconnaissance tools can ingest that documentation and automatically generate attack payloads, leaving API docs publicly accessible isn’t just an information leak, it’s handing the attacker an instruction manual.
The database exposure figures are equally telling. The report references the 2020 PLEASE_READ_ME ransomware campaign that compromised over 250,000 databases by brute-forcing weak credentials on exposed MySQL instances. That was five years ago, and 26% of organizations still have MySQL databases visible on the internet.
This isn’t a knowledge problem, as security teams already know exposed databases are a risk. It’s a prioritization and visibility problem, where the exposed asset either isn’t known to the security team or sits in a remediation queue behind hundreds of other issues competing for the same limited engineering cycles.
The Midmarket Remediation Trap
The remediation data by organization size reveals a pattern I’ve been tracking across my prior work with Intruder, and it reinforces the structural argument from the Security Middle Child report.
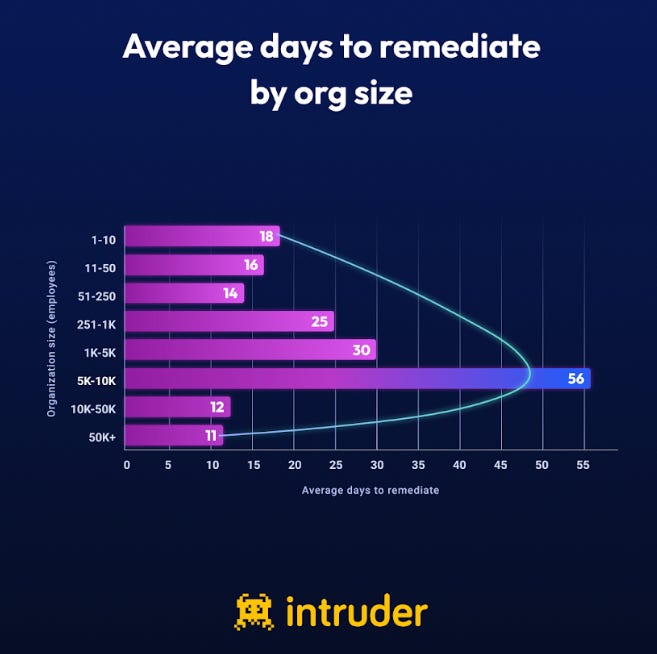
The smallest organizations (1-250 employees) remediate fastest, averaging 14-18 days. The largest enterprises (50,000+ employees) are even faster at 11 days. But the organizations in between, specifically the 5,000 to 10,000 employee band, have the slowest average remediation time at 56 days.
That’s not a random distribution, but instead is a systemic signal. Small organizations have small attack surfaces and tight feedback loops between the person who finds the issue and the person who fixes it. Large enterprises have the budget, headcount, and tooling maturity to throw resources at the problem. The midmarket has the attack surface complexity of an enterprise without the resources to match.
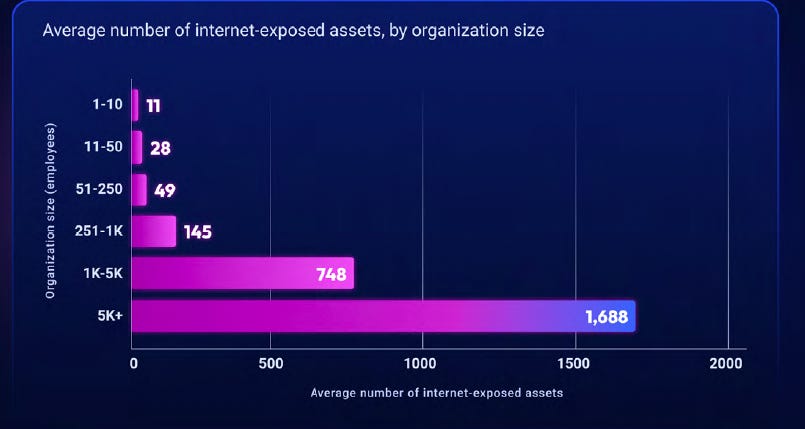
The internet-facing asset counts make this concrete. Organizations with 5,000+ employees manage an average of nearly 1,700 external assets. That’s more than twice as many as those in the 1,000-5,000 band, and the inflection point in both scale and difficulty sits right in that middle range where headcount and tooling haven’t caught up to the size of the perimeter. As I covered in Security in the Middle, 42% of midmarket security teams describe themselves as stretched, overwhelmed, or consistently behind. The remediation data here explains why. These teams aren’t slow because they’re negligent. They’re slow because the ratio of exposed assets to available engineering capacity makes faster remediation physically impossible without either reducing the attack surface or significantly increasing the resources dedicated to managing it. Neither of these are an easily solved problem, as the security team can’t often dictate the asset footprint, the business does. Conversely, security also has to live within finite budgets and resources, leading to challenges with coverage.
The 56-day average for the 5,000-10,000 employee band compared to the 11-day average for organizations with 50,000+ employees isn’t a marginal difference. It’s a 5x gap that represents weeks of additional exposure during which any of those issues could be exploited. For the midmarket CISO reading this, the implication is that remediation speed isn’t primarily a process problem or a tooling problem. It’s a resource allocation problem that requires either a fundamentally different approach to attack surface management or a honest conversation with the board about what the current headcount can actually protect.
Industry Disparities Tell a Structural Story
The industry-level remediation data is where the report gets genuinely interesting, because the variance across sectors reveals how much industry structure, regulatory pressure, and business model shape security outcomes.
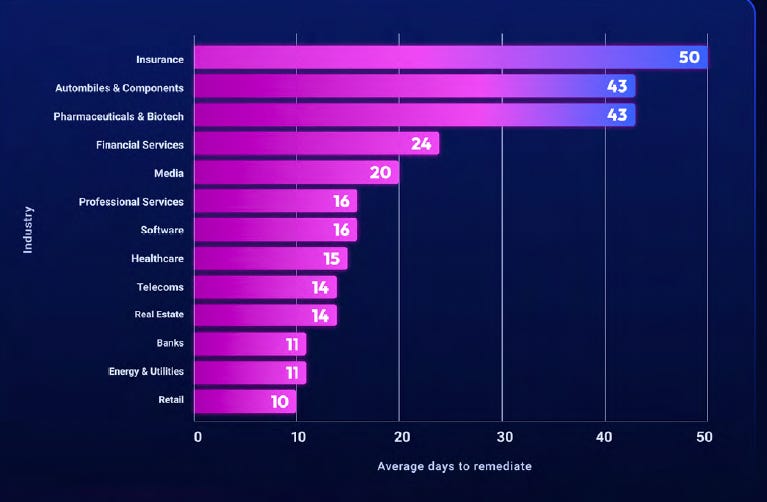
Insurance organizations have the slowest average remediation time at 50 days, while Retail remediates fastest at 10 days. That’s a 5x gap between industries, and it maps cleanly to architectural and operational differences rather than to any measure of security investment or intention. Insurance also has the largest attack surface per asset at 4.1 internet-facing services per asset compared to the cross-industry average, which compounds the remediation challenge. More services per asset means more things that can go wrong per target, and more things that need to be fixed when they do.
The split between Banks and Financial Services is revealing. Banks remediate in an average of 11 days while the broader Financial Services category takes 24 days, more than twice as long. Both operate under heavy regulatory pressure, both presumably invest significantly in security, and both understand the consequences of a breach. The difference is likely architectural and operational. Banks tend to have more mature, more consolidated infrastructure with stronger central security governance, while the broader Financial Services category includes a wider range of organizational maturity and infrastructure complexity.
Pharmaceuticals and Biotech remediate at 43 days and Automobiles and Components at 43 days, both sectors with significant resources that you’d expect to move faster. But both also tend to have complex, legacy-heavy infrastructure with operational technology components that slow down patching cycles. Healthcare, which often gets positioned as the industry with the worst security posture, actually remediates at 15 days, faster than Financial Services, Insurance, Pharma, and Auto. That likely reflects the regulatory pressure from HIPAA combined with the relatively modern, cloud-hosted infrastructure that many healthcare organizations have adopted in recent years.
The practitioner takeaway from the industry data isn’t about ranking sectors from best to worst. It’s that remediation speed is a function of organizational structure, infrastructure architecture, regulatory pressure, and operational maturity, and those factors vary more within industries than the averages suggest.
An insurance company running a modern cloud-native stack will remediate faster than a software company running legacy infrastructure, regardless of what the industry averages say. The averages are useful as benchmarks, but the real value is understanding which structural factors in your own environment are constraining your remediation speed and whether those constraints are fixable or inherent.
The Persistence of Old Vulnerabilities
One of the most consistent findings across both this year’s report and the 2025 Exposure Management Index I covered previously is that old vulnerabilities don’t go away. As I discussed in that earlier analysis, AI is lowering the technical barrier for exploitation, making it faster and more cost-effective for attackers to write new exploits targeting older CVEs that organizations left unpatched. The 2026 data reinforces this pattern. The same classes of exposures, open databases, exposed admin panels, publicly accessible configuration files, keep showing up year after year because organizations address individual instances without fixing the systemic conditions that produce them.
This is the remediation gap in its purest form. The rate at which new exposures appear, driven by infrastructure growth, cloud migration, shadow IT, and AI-accelerated development, consistently outpaces the rate at which security teams can identify and fix them. As I covered in The Attack Surface Exponential, GitHub is on pace for 14 billion commits in 2026, a 14x year-over-year increase driven by AI coding agents, and each of those commits potentially introduces new assets, new services, and new attack surface that the security team may not even know exists.
The exposed API documentation finding connects directly to this dynamic. As organizations deploy more APIs to support AI integrations, agent-to-agent communication, and microservices architectures, the number of potential information leaks and attack entry points multiplies. When 15% of organizations have API documentation publicly exposed and AI tools can automatically parse that documentation to identify exploitable patterns, the gap between how fast attack surface grows and how fast security teams can manage it becomes a strategic risk rather than an operational nuisance.
What Continuous Visibility Actually Changes
The structural argument running through all of this data is that periodic assessment can’t keep pace with continuous change. Running a quarterly penetration test or an annual vulnerability assessment against an attack surface that changes daily is the security equivalent of checking your bank balance once a year and assuming the number is still accurate. The organizations in this data set that remediate fastest aren’t doing so because they have better remediation processes. They’re doing so because they have continuous visibility into what’s exposed and can address issues as they appear rather than discovering them weeks or months later during a scheduled assessment.
This is where the shift from periodic vulnerability scanning to continuous attack surface management becomes a practical necessity rather than a vendor talking point. The data shows that the organizations with the fastest remediation times, the small organizations with tight feedback loops and the largest enterprises with mature tooling, share a common trait.
They’ve reduced the time between “something is exposed” and “someone knows about it” to near zero. The midmarket organizations struggling at 30-56 days haven’t necessarily failed to adopt the right tools or processes. They’ve failed to close the visibility gap, and until that gap closes, remediation will always lag behind exposure.
Intruder’s approach to this problem, continuous monitoring of internet-facing assets with automated discovery of unknown or unexpected services, directly addresses the visibility constraint that drives the remediation delays visible in the data. When a large portion of detected assets are unknown to the organization, and exposed databases persist at 26% prevalence five years after a mass exploitation campaign demonstrated the consequences, the problem isn’t that organizations don’t understand the risk. It’s that they can’t fix what they can’t see, and they can’t see what they aren’t continuously monitoring.
The Honest Conversation
The 2026 Attack Surface Management Index paints a picture that should be familiar to anyone who has been working in this space for more than a few years. The specific numbers change, remediation times improve in some categories, new exposure types emerge as architectures evolve, but the structural pattern holds.
Organizations are operating with more internet-facing assets than they realize, those assets expose basic security issues at rates that haven’t fundamentally changed, and the capacity to address those issues is distributed unevenly based on organizational size and industry structure.
The honest conversation this data forces is about expectations. If your organization sits in the midmarket band with 250 to 10,000 employees and your remediation times look anything like the 25-56 day averages in this report, the path forward isn’t telling your team to work harder or faster.
The path forward is either reducing the attack surface they’re responsible for, giving them continuous visibility into what’s actually exposed so they can prioritize based on real-time risk rather than periodic snapshots, or getting the headcount and budget that matches the actual size of the problem. Any other approach is asking people to bail water out of a boat faster than it’s coming in, and this data shows exactly how that works out.
"or getting the headcount and budget that matches the actual size of the problem."
And whose fault is that?
As usual: Management.
A management that is ignorant about security - and since it's not a profit-maker, couldn't care less.
Also, they're making a "risk assessment" - increase profits vs reduce profits by spending on security - a risk that may or may not occur during their tenure as management.
In essence, it's Bruce Schneier's "people are bad at assessing risk" problem.
Scale this across all organizations, and wallah! Cybersecurity crisis.
Now tack AI on top of that. Cybersecurity apocalypse.
There is only one solution: Using deterministic AI - NOT LLMs - to produce provable correct code - and also to monitor the organization's non-code risks (because it doesn't matter if the code is provably correct if your perimeter problems remain.)