

Earlier this year I wrote about Sergej Epp’s Zero Day Clock in an article titled “The Zero Day Clock Is Ticking,” and followed it up with a podcast conversation with Sergej himself.
At the time, the clock was a single, blunt instrument built on roughly 3,500 CVE-exploit pairs, showing the median time-to-exploit collapsing from 771 days in 2018 to 4 hours in 2024, with the majority of exploited vulnerabilities in 2025 being exploited before public disclosure.
It made the compression of exploitation timelines legible to people outside of the vulnerability management trenches in a way a hundred vendor reports had failed to and as a result, it became a widely cited resource across not just cyber but others when discussing cybersecurity as well.
That said, the Zero Day Clock that exists today is a different animal.
The headline “clock” is gone, replaced by what the project now calls “a public scoreboard for vulnerability management and exploitation,” with an Observatory, an Explorer, a timeline they call “The Collapse,” a ten-point Call to Action, and a signatories list that now includes names such as Bruce Schneier, Heather Adkins, Jeff Moss, Paul Vixie, George Kurtz, and Joe Sullivan, among others, including myself, as I’m a big fan of the work Sergej Epp is doing here.
In this article, I want to walk through what changed, what the new numbers actually say, and what practitioners, CISOs, and AppSec teams should take from it, along with where AI continues to bend the curve.
So, let’s dive in.
From a Clock to an Observatory
The biggest change is philosophical rather than visual.
The original clock’s entire premise was a time-to-exploit metric. The new version explicitly refuses to publish one, and the reasoning is worth understanding, because it applies to plenty of the metrics we throw around internally too.
Below is their direct explanation, but I will break it down as well:
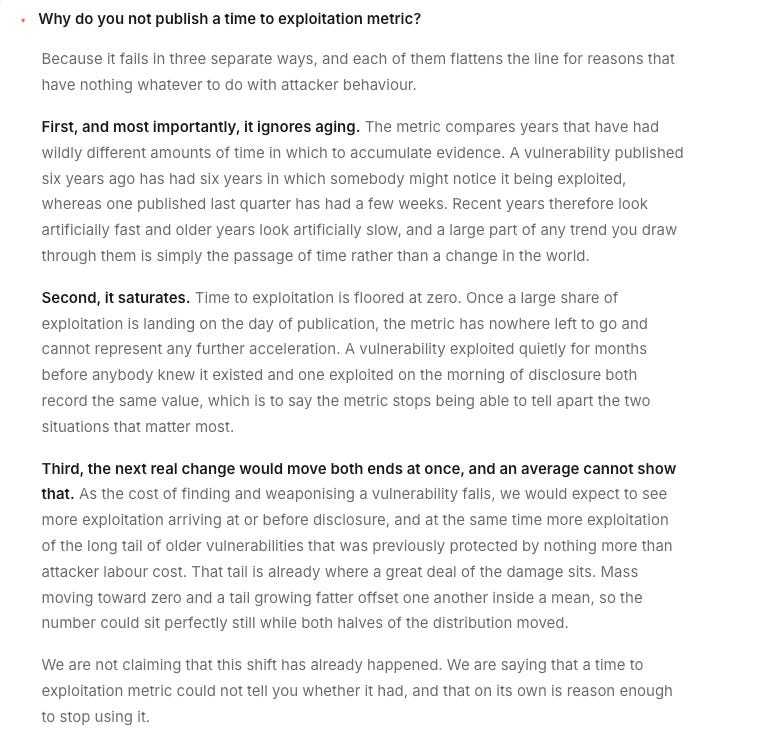
The project lays out three problems with time-to-exploitation as a headline number.
It ignores aging, meaning recent vulnerabilities look artificially fast because the slow ones haven’t been exploited yet. It saturates, since a metric floored at zero can’t represent further acceleration once exploitation happens on or before disclosure day, and both ends move simultaneously, so a shrinking median can’t distinguish between attackers migrating toward disclosure day and a growing long tail of old vulnerabilities being exploited years later.
To be fair, that critique cuts against the version I wrote about in March, and the project is upfront about it. The site is now built around principles it describes as:
Neutral - No vendor, no product and no thesis that needs protecting
Independent - Funded by nobody who appears in the data
Long term - Built as an instrument rather than as a report
For those unfamiliar, the project grew out of the Unprompted conference in San Francisco earlier this year. However, despite that, it is framed as not being a project deliberately about AI, because an instrument build for one narrative tends to measure that narrative and little else.
I find that framing refreshing in an industry where nearly every dataset is published by someone with a product to sell. The data now comes from nine public feeds (CISA KEV, EUVD KEV, CIRCL KEV, VulnCheck KEV, Shadowserver’s honeypot network, MSRC, the CVE Program, NVD, and EPSS), and the four KEV catalogues are deliberately kept separate rather than merged, because in the project’s words the disagreement between them “is itself the finding.”
Just as useful is the list of things the project says it cannot measure, which includes how much vulnerability exists in the world, whether anybody was actually compromised, when exploitation genuinely began, the risk to your own organization, and whether a decline is good news.
If more security dashboards shipped with that disclaimer, we’d have far fewer board slides built on false precision.
What the Numbers Say
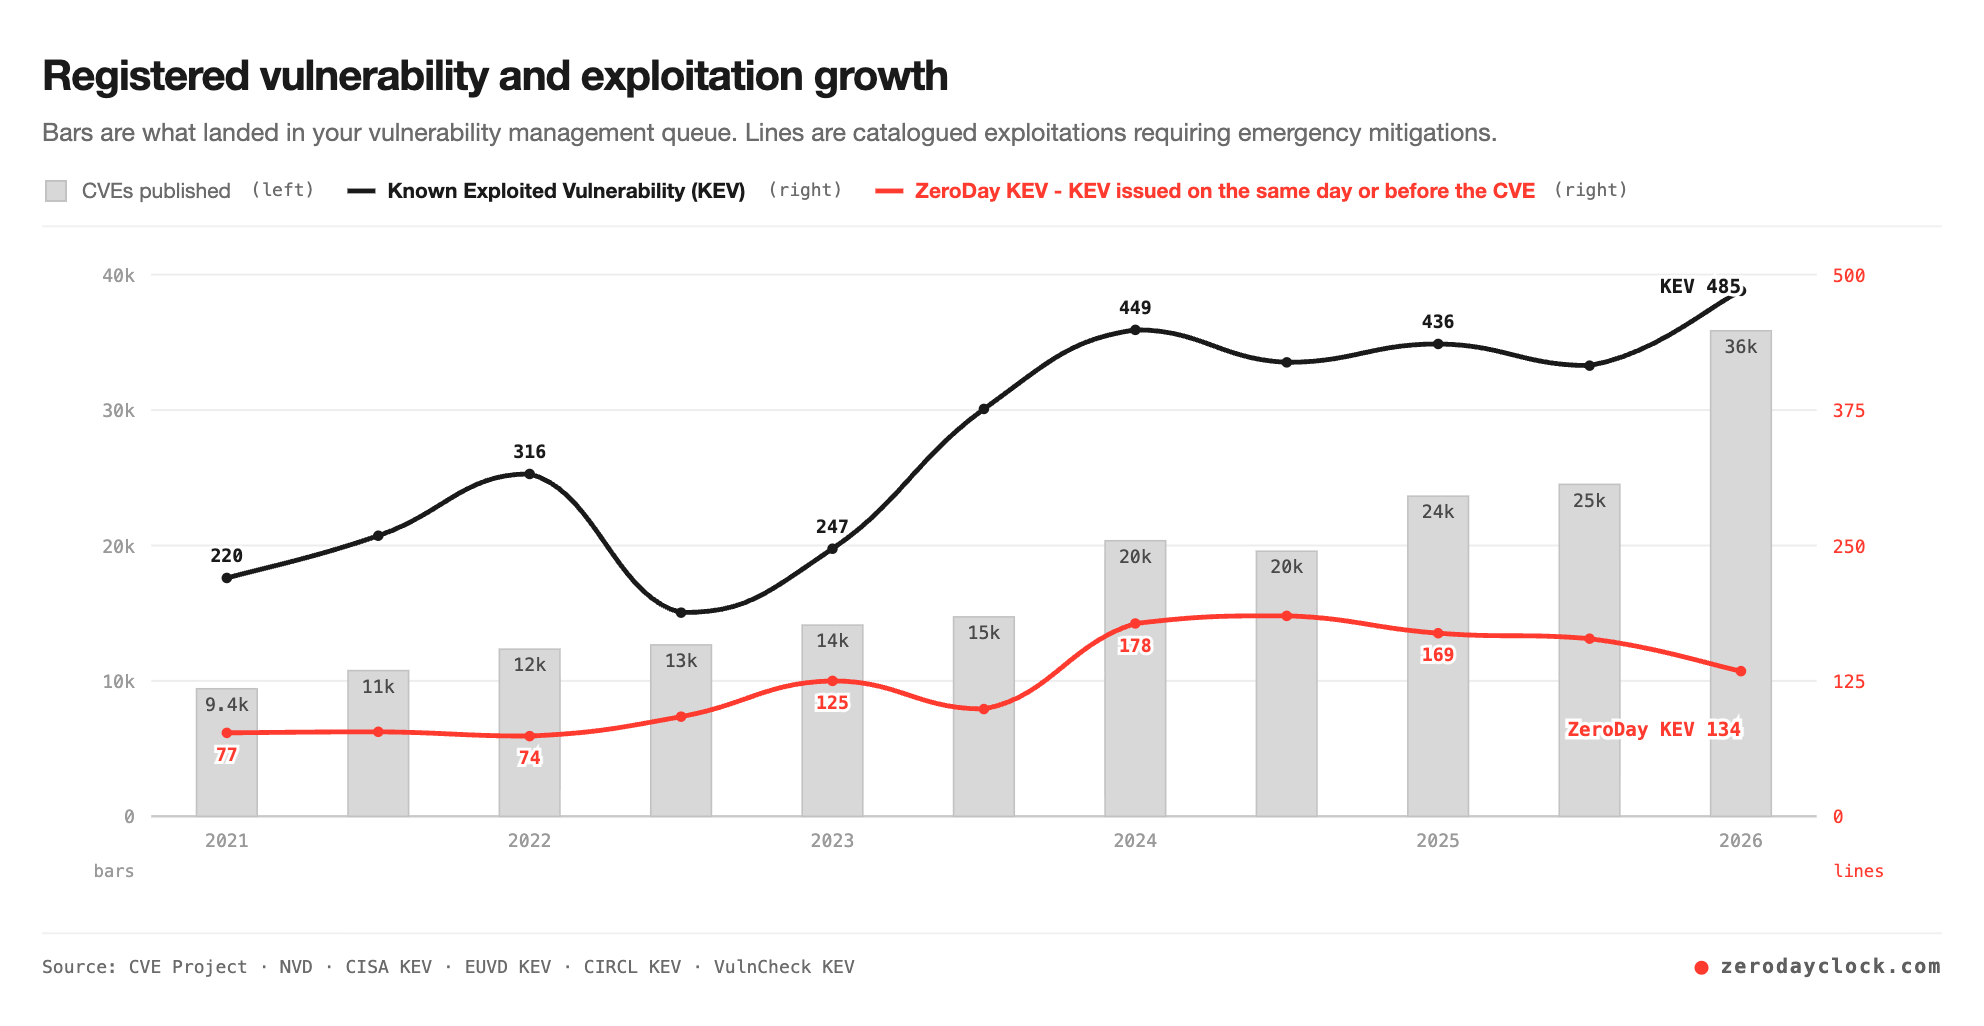
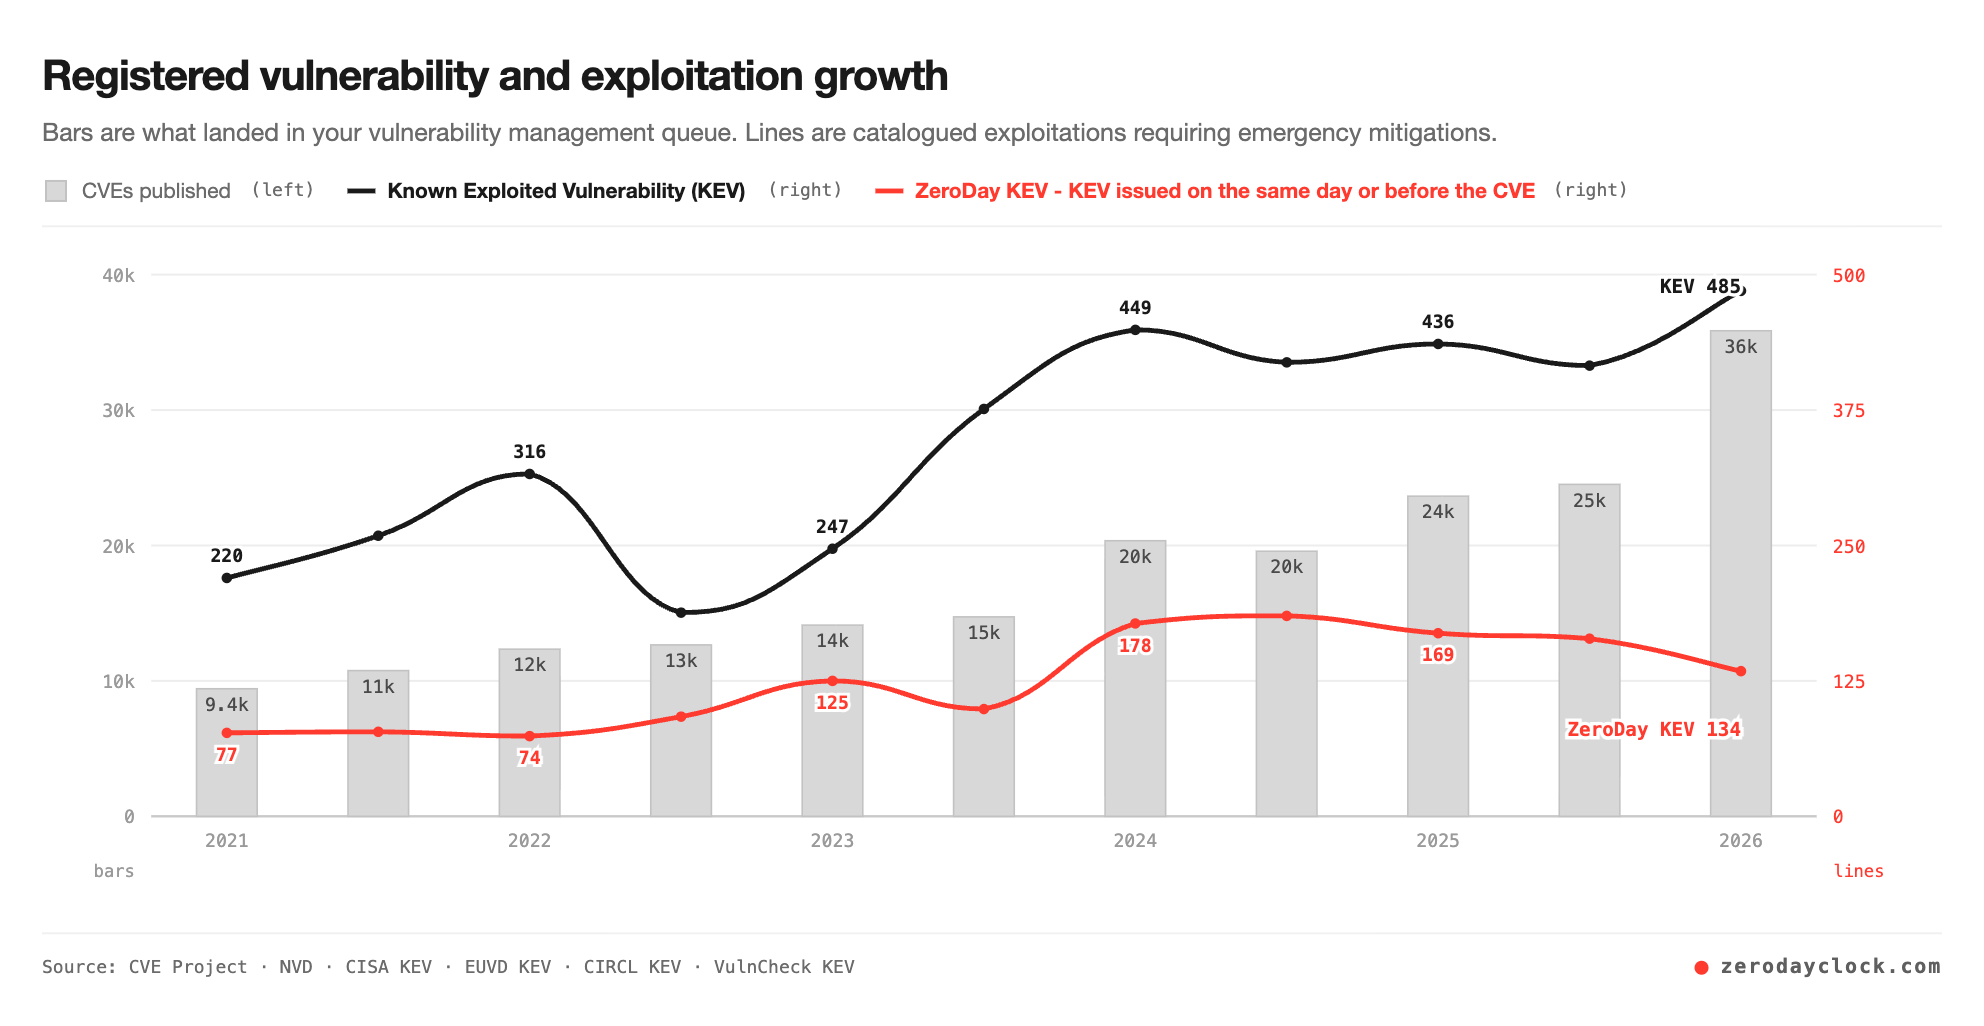
The Observatory’s opening chart tells the story in three numbers for the first half of 2026.
There were 35,853 vulnerabilities published, 484 newly named as exploited, and 133 of those were already being exploited when they went public. Through eight months of 2026, the count sits at 57,884 published CVEs and 674 KEV listings, and the project intentionally never divides one into the other, because publication counts and catalogue listings are driven by different forces.
Zoom out and the KEV trend is the one for security leaders to pay attention to. Annual KEV listings across the combined catalogues went from 48 in 2021, to 95 in 2022, 127 in 2023, 221 in 2024, 479 in 2025, and 674 in 2026 with four months still to go. Even allowing for better catalogue coverage over time, that is a curve that has roughly doubled every year or two.
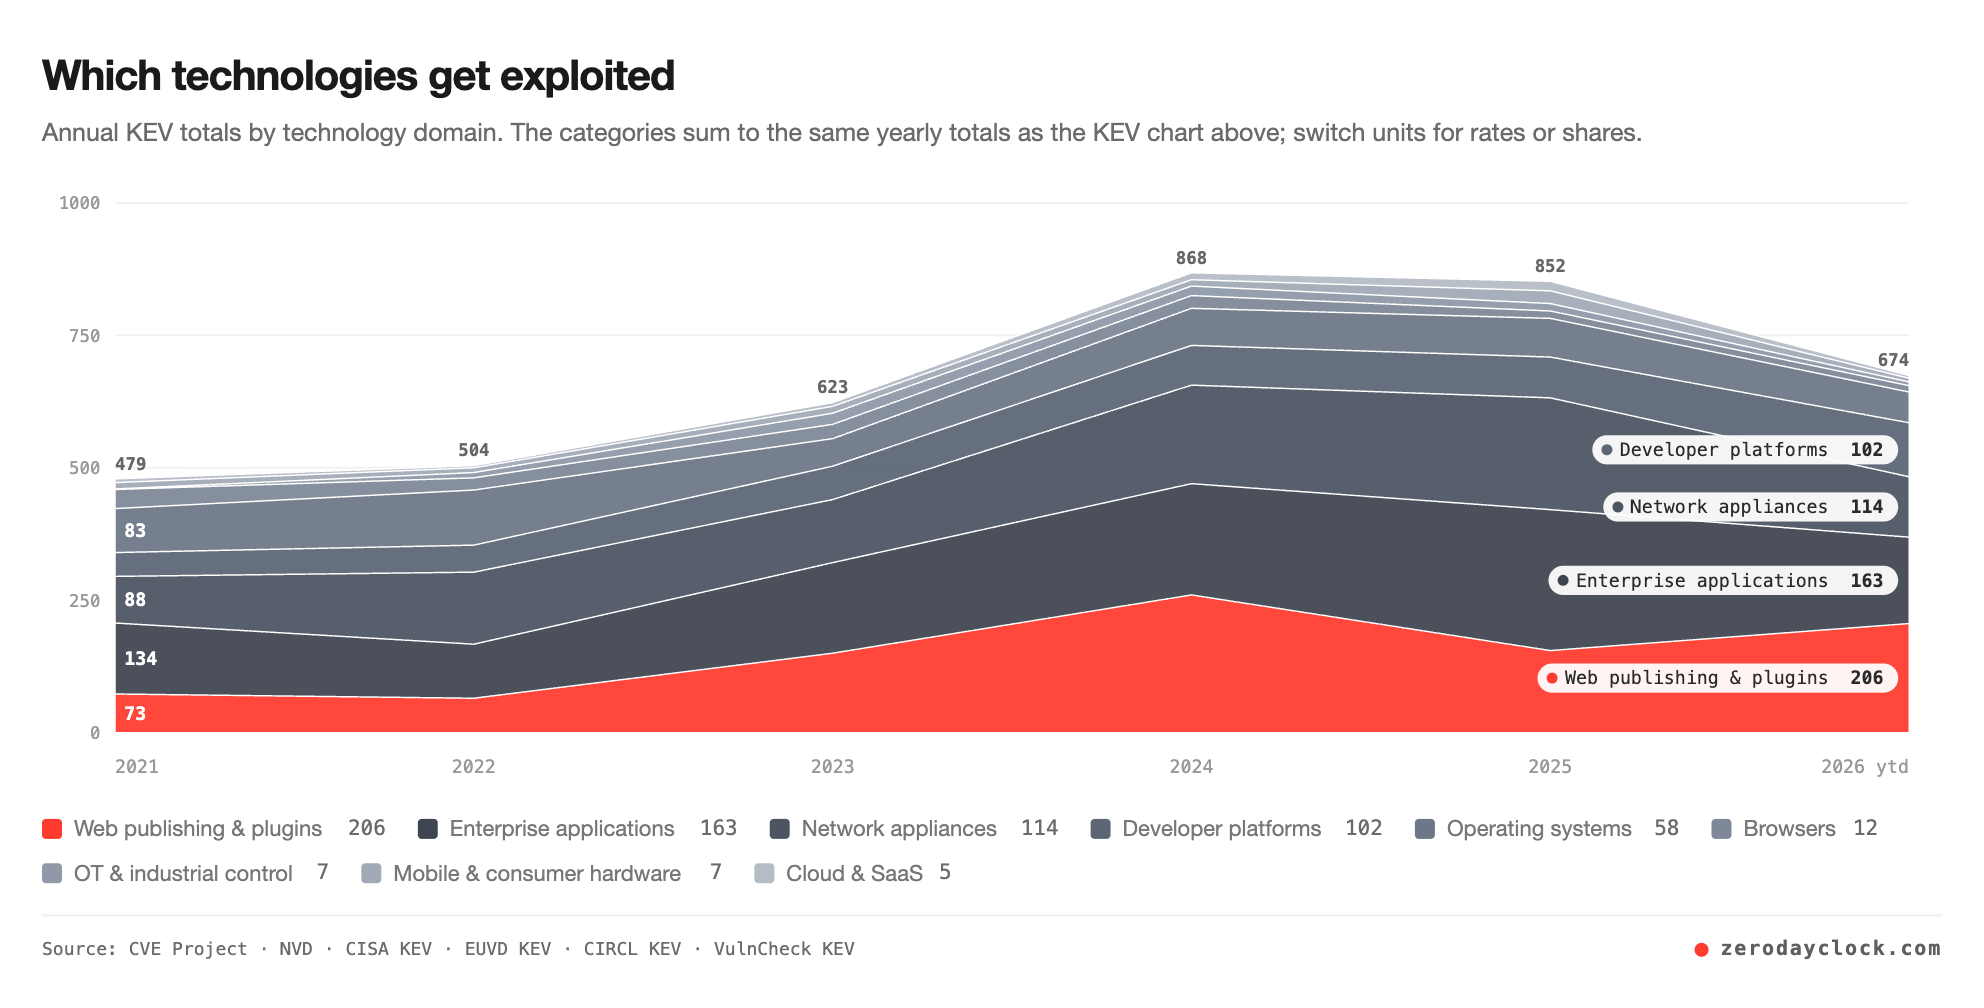
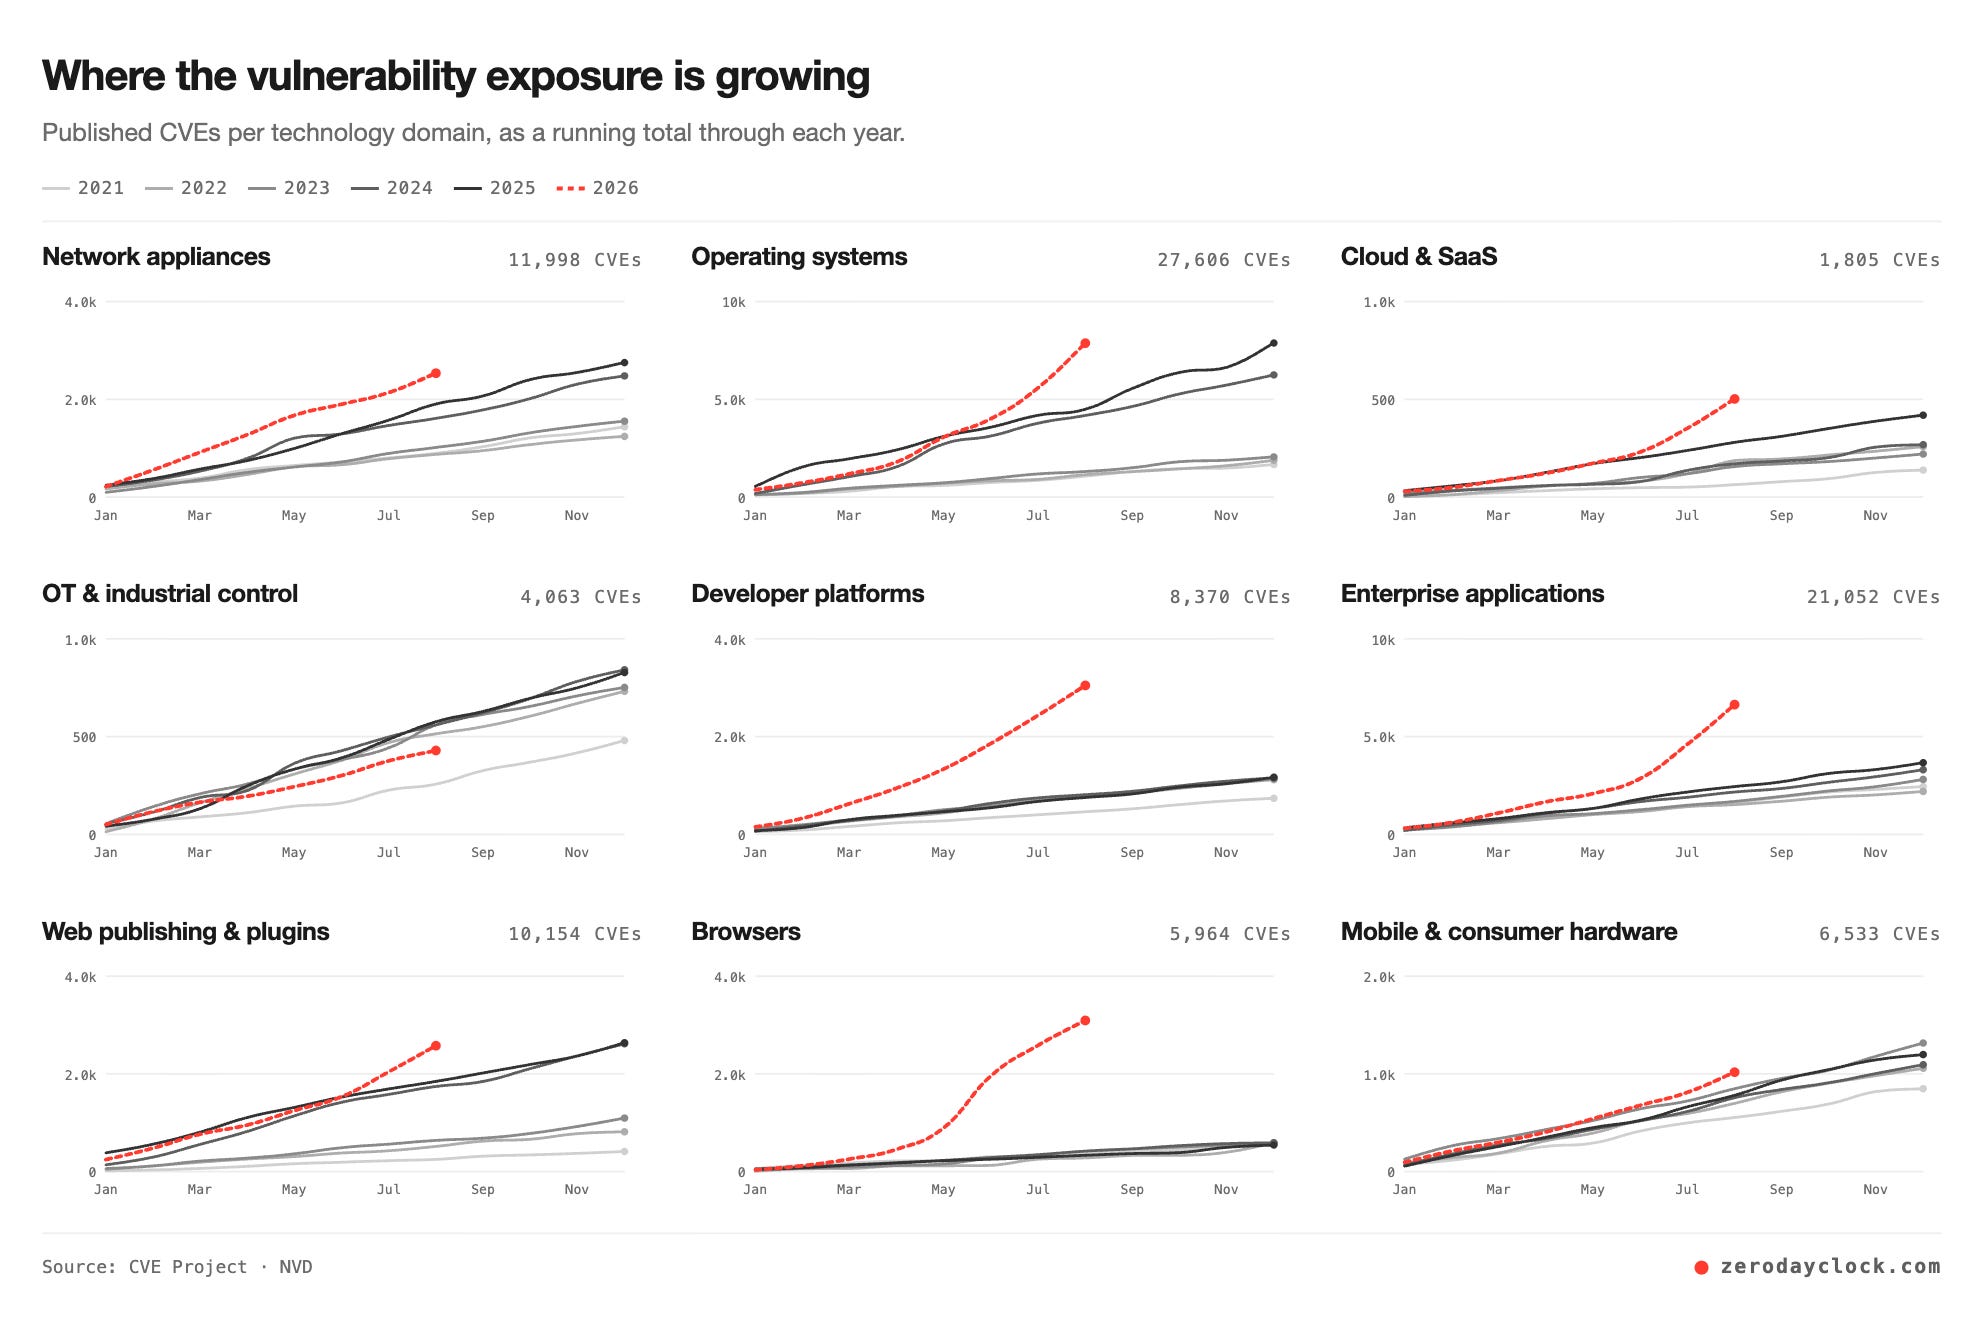
The technology breakdown is where it gets practical. For 2026 year-to-date, web publishing and plugins lead with 206 exploited vulnerabilities, followed by enterprise applications at 163, network appliances at 114, developer platforms at 102, and operating systems at 58.
Browsers, OT, mobile hardware, and cloud/SaaS are all in the single or low double digits. Per the project, web publishing and plugins grew from 6.1 to 25.8 listings per month while operating systems stayed relatively flat at 6.9 to 7.3, meaning nothing moved away from the OS, everything else simply grew around it.
The newer Vulnerability Pressure Index compares the latest complete quarter against the same quarter a year earlier. For 2026Q2, vulnerability pressure reads 270% year-over-year (30k new vulnerabilities in three months versus 11k in the same quarter of 2025), scanning pressure reads 42% (212k honeypot attempts versus 500k), and zero day exploitation pressure reads 78% (93 vulnerabilities exploited on or before disclosure versus 119).
The project is careful to note that 100% isn’t “normal,” with a typical vulnerability pressure reading around 118%, and that each stream compares only against its own past.
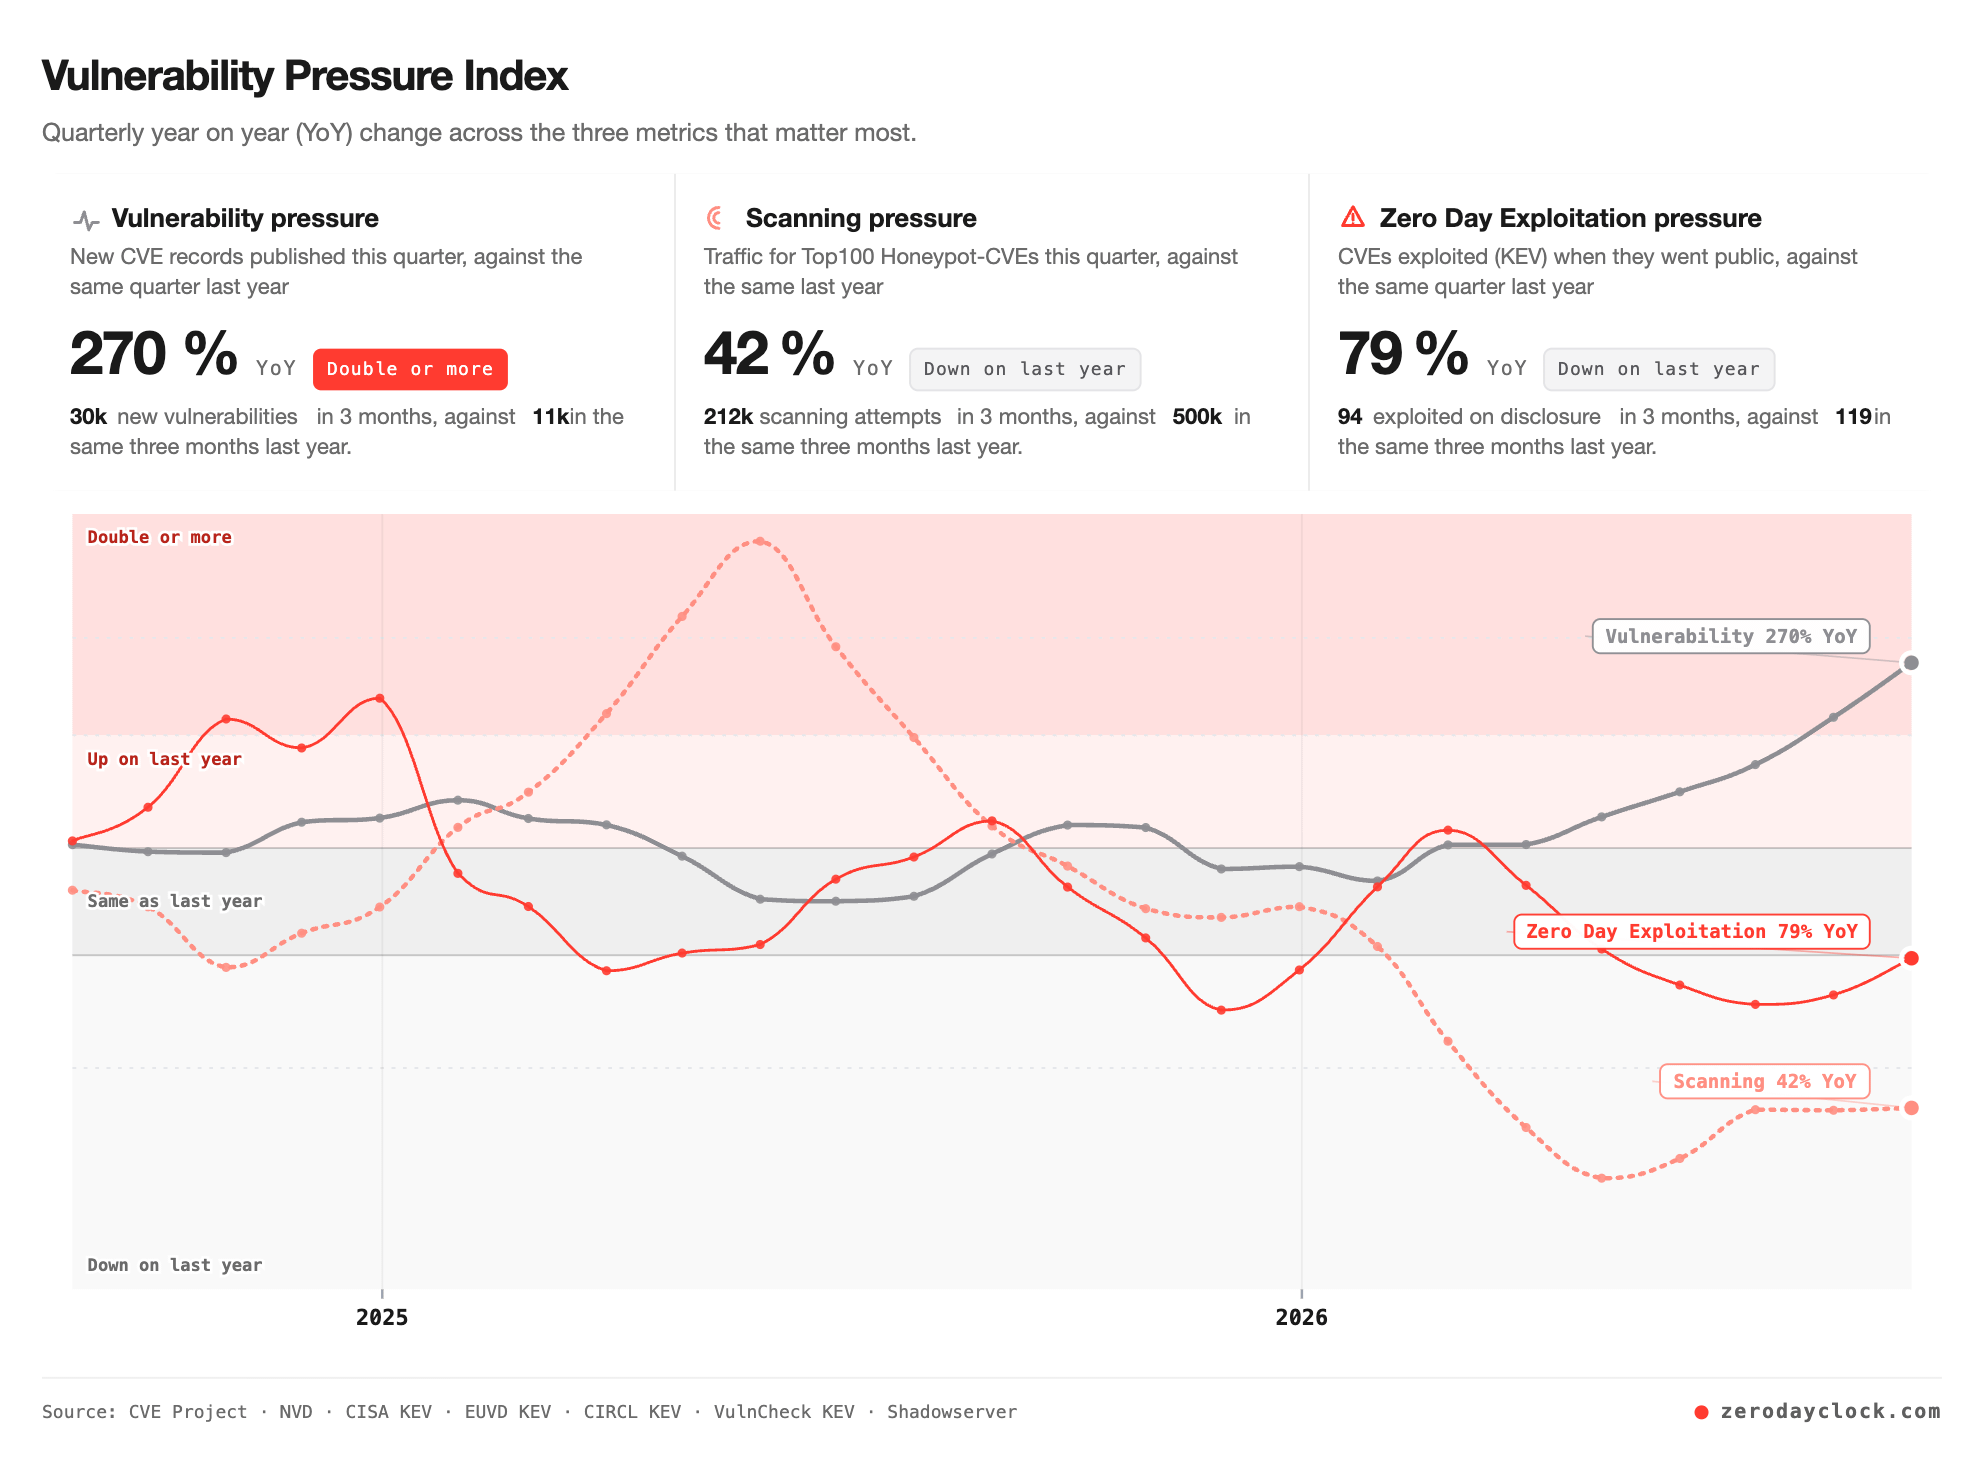
Now, I’ll admit that two of those three readings are down on last year, and someone inclined to declare victory could do so. That said, the project’s own list of unmeasurable includes “Whether a decline is good news,” and the scanning figure in particular is qualified by sensor reporting variations. The number that hasn’t declined is the one that lands in your backlog, and it nearly tripled.
Two more findings round out the picture. On severity, the site finds that critical vulnerabilities are attacked at 269 per 10,000 versus 92 for high, so CVSS does separate risk, and yet 61% of everything actually attacked was rated below critical, simply because high-severity vulnerabilities vastly outnumber critical ones.
On age, the honeypot data shows attackers hammering vulnerabilities that are years old. The most scanned CVEs for the week of August 28 through September 3 included a 2025 GeoServer flaw and this year’s SharePoint vulnerability alongside Fortinet CVEs from 2022 and 2018, a Citrix flaw from 2019, and a PHPUnit vulnerability from 2017.
The site’s own caveat is a good one, “Empty space is not safe space,” since honeypots have observed 45% of network device KEV, 2% of OS flaws, and nothing from Apple.
The KEV Problem
All of the exploitation figures above hinge on the word “catalogued,” and that deserves scrutiny, because the catalogue most of the industry treats as ground truth is CISA’s KEV. The project’s decision to run four KEV feeds side by side rather than merging them is a quiet acknowledgment that no single catalogue is the truth, and the gap between them is bigger than most vulnerability management programs assume.
To level set, CISA KEV was built as a directive for federal civilian agencies under BOD 22-01, with an inclusion bar that requires a CVE, reliable evidence of exploitation, and clear remediation guidance. That makes it authoritative and conservative by design, and conservative is a problem when it becomes your only exploitation signal.
VulnCheck’s KEV, which is free to community members and is one of the four feeds the Zero Day Clock ingests, claims approximately 80% more CVEs exploited in the wild than any other public catalogue, with citations behind every entry. In VulnCheck’s “State of Exploitation 2026” report, my friend Patrick Garrity found 884 KEVs with first evidence of exploitation in 2025, across 518 vendors and 672 products, while CISA added 245 KEVs across 99 vendors and 146 products over the same period.
VulnCheck’s 118 first-reporting sources added evidence “more than 85 percent of the time, often predating CISA by days, months, or even years,” and 28.96% of its 2025 KEVs were exploited on or before the day their CVE was published, up from 23.6% in 2024. That last figure is the same phenomenon the Zero Day Clock’s “ZeroDay KEV” line tracks, seen from a broader catalogue.
Empirical Security’s whitepaper “How to Deal with Speed” goes further and, to me, lands the harder blow.
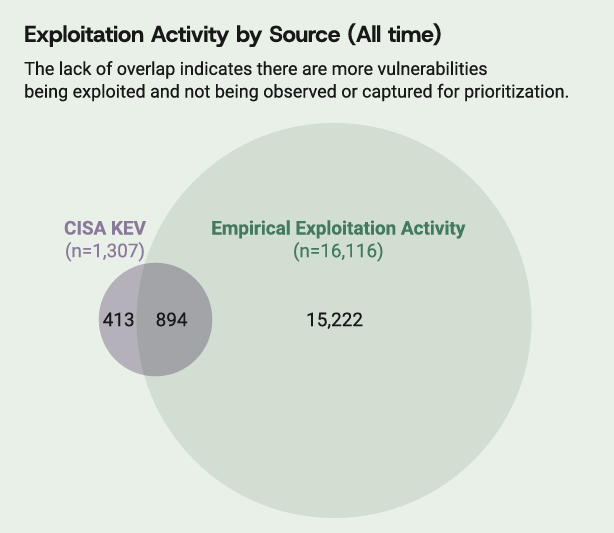
When pulling data for the 2025 DBIR, across roughly six years of observed history, Empirical counted 16,116 CVEs with exploitation activity. CISA KEV held 1,307 of them, Empirical’s telemetry corroborated 894, which leaves 413 KEV entries they cannot see at all and 15,222 actively exploited CVEs that never reach the catalogue.
Additionally, Empirical found that more than half of the entries on the KEV were last observed with exploitation activity over three years ago, “yet a scanner, vulnerability intelligence tool, or exposure management platform finding one of them today fires the same alarm as a flaw under attack this morning.”
Empirical’s broader point is that exploitation is a time series rather than an on/off state.
In their data, a vulnerability with exploitation activity today has a 32.3% chance of being exploited again tomorrow, a 52% chance within the next seven days, and a 65.1% chance within 30 days, and the activity clusters into persistent, frequent, occasional, and rare patterns, with persistent vulnerabilities showing activity on 95.4% of days and rare ones on 4.8%.
KEV entries skew heavily toward the persistent and frequent clusters (48% and 35%), which is another way of saying the catalogue captures the loud, long-running exploitation and misses the long tail. Their conclusion is that prioritizing by exploitation evidence rather than CVSS severity produces about a 29-fold improvement in efficiency for the same remediation effort, which pairs neatly with the Zero Day Clock’s own severity finding above.
Now, none of this means CISA KEV is useless. It is free, it is authoritative for federal agencies, and a KEV hit still deserves attention. That said, treating it as a complete or current picture of exploitation is a mistake, and the Zero Day Clock’s decision to show the catalogues disagreeing with each other is more honest than the single-catalogue view most dashboards ship with.
What It Means for CISOs
The first implication is the one I made in March and will keep making. Finding vulnerabilities has never been the hard part, the hard part is fixing them, and the data now supports that in both directions.
Disclosure volume is up roughly 270% year-over-year for the quarter, and the ceiling on remediation capacity hasn’t moved. Empirical puts it plainly, “the answer to speed is not to patch faster,” because very few organizations can win a throughput contest against a disclosure curve with no upper bound, and the alternative is sorting better before you run. If your program is still reporting mean-time-to-remediate against a 30-day SLA, you’re measuring adherence to a policy, and exposure is a different question entirely.
Or, as one would call it, you’re performing compliance/security theater, not risk management.
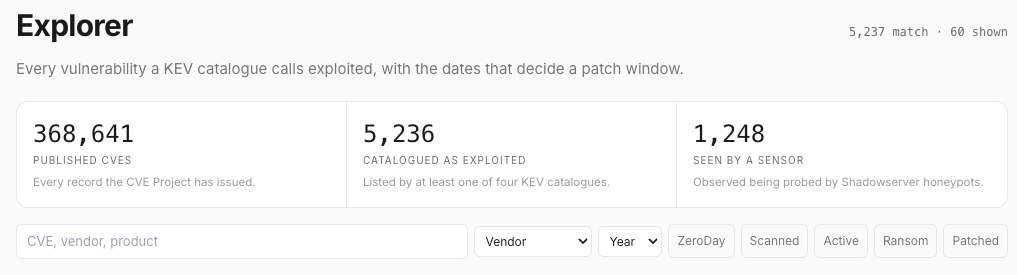
Closely related, if your “known exploited” signal is CISA KEV alone, you are working from a catalogue that Empirical’s telemetry suggests misses the large majority of exploited CVEs and carries entries that haven’t seen activity in years. Layering in VulnCheck KEV, EPSS, and honeypot telemetry such as Shadowserver’s is table stakes at this point, and the Zero Day Clock’s Explorer is a reasonable place to see how the catalogues disagree on your vendors.
The second implication is that the zero-day framing has become a distraction for most organizations.
Yes, 133 of the vulnerabilities named as exploited in the first half of 2026 were already being exploited when published, and that matters for the vendors and the handful of organizations targeted first. For everyone else, the week’s scanning chart says the attackers’ bread and butter is a Fortinet CVE from 2018 and a PHPUnit bug from 2017.
The Collapse timeline cites Shadowserver data showing 68% of attacked known vulnerabilities in a recent sample were published before 2024, with a single 2018 Fortinet CVE drawing 56,864 attacks in one week. The N-hour exploitation window and the N-year backlog are the same problem viewed from two ends, and boards tend to hear only about the first one.
Third, the technology breakdown should reshape where you spend. Network appliances, enterprise applications, and web platforms are where the KEV listings concentrate. If your vulnerability management program is still weighted toward endpoint OS patching because that’s where the tooling is mature, the exploitation data is telling you the attackers went elsewhere.
Finally, the project’s Call to Action is aimed at the structural level, with demands for vendor liability, security by default in platforms, memory-safe languages for new critical infrastructure code, open-sourced defensive AI tooling, and regulation redesigned for machine-speed defense, to name a few. It explicitly lays out 10 items in the Call to Action:
Hold the Makers Accountable
Build Security into the Platform
Stop Patching, Start Rebuilding
Eliminate the Root Cause
Open-Source the Defense
Regulation for Machine Speed
Bridge the Gap Between Hackers and Policy
Zero Trust, Everywhere
Treat Cyber as Statecraft
Fund the Defense
I’ve argued before that voluntary pledges won’t move vendors, and I still believe that. CISOs won’t fix vendor liability on their own, but they can start pricing exploitation history into procurement, and the site’s Explorer view, filterable by vendor and year, makes that fairly easy to do, but it’s up to us as a community to actually make use of it.
What It Means for AppSec Teams
For AppSec, the most relevant number is the developer platforms category, which is fourth on the exploitation list at 102 KEV listings for 2026 year-to-date.
That bucket covers the build systems, frameworks, and tooling we rely on to produce software, and it is being exploited at nearly twice the rate of operating systems. The web publishing and plugins category leading the list at 206 is a reminder that the long tail of CMS plugins and web frameworks remains the softest target on the internet, and much of that is code your organization runs but never wrote.
The severity finding matters here too. AppSec programs love CVSS thresholds because they are simple to encode in a policy, and the data says critical vulnerabilities really are exploited at a higher rate. It also says that most of what gets exploited is rated high or below.
A gate that only blocks criticals is letting through the majority of what attackers actually use, and a gate that blocks everything above medium is how you end up as the “office of no”.
The way out, as I’ve written about repeatedly, is context, which means reachability, exploitation intelligence from sources richer than CISA KEV alone, and runtime exposure, rather than a severity score in isolation. Empirical’s 29-fold efficiency figure for exploitation-based prioritization over CVSS is the kind of number that should end the CVSS threshold debate with engineering leadership.
There’s also a disclosure angle for AppSec teams that ship software. Per the project’s zero-day definition, 88% of vulnerabilities with a KEV listing on or before publication had a patch available on or before disclosure where vendor dates exist. That’s coordinated disclosure working as designed, and it still leaves defenders with no advance warning, because the attacker’s timeline now starts at the patch, and the data below suggests that timeline is measured in hours.
AI’s Continued Impact
The Collapse timeline is where the AI thread runs, and it has been extended since March.
The entries I covered then are still there, from Daniel Kang’s work showing GPT-4 exploiting known flaws with an 87% success rate at $8.80 per exploit, to Sean Heelan generating 40 working exploits for a single flaw at a cost of $50, to Dinkin and Kraft finding 100+ exploitable kernel driver vulnerabilities for $600 total. Heelan’s line remains one of the better summaries of where this goes:
“The limiting factor on a state’s ability to develop exploits will be token throughput, not hacker count.”
The newer entries push the timeline from N-day to what Anthropic’s June research on measuring LLMs’ impact on N-day exploits calls N-hour. In that work, Mythos Preview had its first working exploit against a Firefox patch within an hour of Mozilla issuing it and ultimately produced eight different exploits in roughly 12 hours, while against Windows kernel bugs its first proof of concept arrived in 31 minutes and all 18 arrived within six hours, at a total cost of $15,700 in API credits, or roughly $2,000 per privilege escalation.
The comparison the paper draws is the one most relevant for a CISO, since it typically takes seven days for a patch to reach 90% of enrolled Windows devices and day 11 before a forced reboot, meaning the model “would have finished creating all eight full chain exploits before any of the Windows devices had received the patch.” As the authors put it, “N-hour is closer to the reality we now operate in.” You can see in the Zero Day Clock Observatory,0 where vulnerability exposure is growing as well.
The timeline also cites Anthropic’s disclosure that Claude found over 500 high-severity vulnerabilities in open source software, with a warning that 90-day disclosure windows may not survive AI-discovered bug volume, and Schneier, Adkins, and Evron’s October 2025 essay gets the closing word:
“The attackers’ AI singularity has arrived. Ours has not yet begun.”
I would argue that is timely, looking at a similar effort as Anthropic’s, in competitor OpenAI’s effort “Patch the Planet” in tandem with Trail of Bits, you can see 66% of issues found are still awaiting patches.
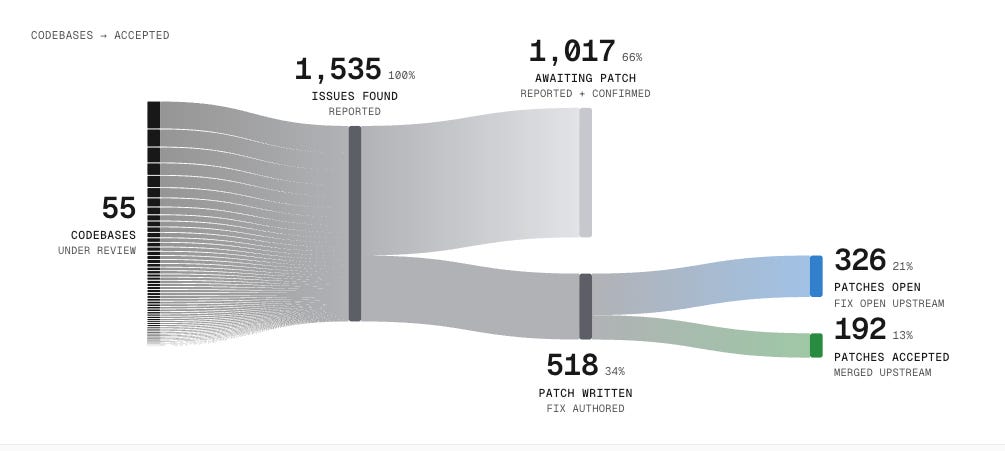
This highlights the bottleneck isn’t finding issues, but the subsequent validation, patch development, institutional triage and ultimately the patches being merged upstream. You can see above in Patch the Planet, only 13% of issues so far have actually had a patch merged upstream.
Now, don’t get me wrong, I remain bullish on AI for defense, and the Call to Action’s demand to open source defensive AI tooling is one I endorse, hence being a signed supporter. That said, Sergej’s Verifier’s Law, which he and I discussed at length on the podcast, explains why offense is compounding faster.
An exploit either works or it doesn’t, which is a cheap, deterministic verifier, while defense gets ambiguous, delayed feedback and has to be right everywhere. Until defenders get feedback loops as tight as a working exploit, the asymmetry persists regardless of how much AI we buy.
Closing Thoughts
It is of course debatable whether the world needed another vulnerability dashboard, and the earlier version of the clock was frankly easier to put in front of a board than an observatory with nine data feeds and a page explaining what it can’t measure.
That said, the rebuilt Zero Day Clock is among the more honest instruments I’ve seen in this space, precisely because it gave up its own headline metric when the data couldn’t support it.
The picture it paints is consistent with everything else we’ve seen this year.
Disclosure volume is roughly tripling, exploitation listings are compounding, attackers are living off old edge-device bugs while AI compresses the window on new ones to hours, and remediation capacity hasn’t budged.
This is both a measurement challenge and structural one, with various systemic, organizational and technical issues at play.
All that aside, this is an excellent data rich resource to discuss the state of vulnerabilities and exploitation with security leaders and practitioners alike.
Focusing on exploitation timelines misses the shift toward behavioral intent. When the clock stops, the attacker is already inside the perimeter moving laterally through legitimate credentials or misconfigurations. This confirms that static vulnerability management is becoming a secondary concern compared to the actual operational choices made by an adversary. We see this when operators ignore known critical vulnerabilities to favor quieter, manual paths that bypass automated detection entirely. Security teams must prioritize identifying these intent-based patterns instead of chasing every high-severity score on the board. The real game is observing the path taken when the obvious doors remain locked.
https://cyrilsimonnet.substack.com/p/three-critical-cves-were-available?utm_source=substor&utm_medium=substack&utm_campaign=comment
The part I'd copy is the page listing what the instrument can't measure. Publishing that next to the numbers is rarer than it should be, and it's what makes the rest of it credible.
"Empty space is not safe space" is the line I'll be reusing. Honeypots saw 45% of network device KEV and nothing from Apple, and a blank cell on a dashboard reads like good news to everyone who didn't build it.