
The Real Price Tag on Breaches
A look at Verizon's Data Breach Impact Study And What the Numbers Teach Us

The cybersecurity industry has spent decades making claims about the financial devastation of data breaches. Vendors sell on fear, conference keynotes invoke existential dread, boards get told that a breach could end the company, and often most of those claims have been built on anecdotal evidence, cherry-picked headlines, and a single average-cost figure from an annual IBM report that few practitioners ever trusted but everyone cited anyway.
That changes with Verizon’s 2026 Breach Impact Study (BIS). Produced by the same team behind the Data Breach Investigations Report (DBIR) and built on a partnership with CyberAcuView, this is a rigorous, insurance-claims-backed analysis of what breaches actually cost. As I covered in The DBIR’s Exploitation Era, the 2026 DBIR gave us the clearest picture yet of how breaches happen. The BIS gives us the other half of that equation, what happens after and how much it costs organizations.
The dataset is substantial, where the research team reviewed approximately 70,000 cyber insurance claims in the United States, of which roughly 38,000 had recorded losses paid out to policyholders.
The claims cover insurable incidents from January 1, 2019, through October 31, 2025. This is not a survey, this is not self-reported, these are actual dollars paid through actual insurance policies, normalized and standardized by CyberAcuView’s member insurers.
The authors are careful to frame these figures as floors, not ceilings.
The dataset captures insurable losses only, meaning it excludes uninsured losses, reputational damage, and non-claim costs. The true economic impact of these incidents is almost certainly higher.
What Breaches Actually Cost
The headline numbers tell a story that should recalibrate how practitioners and executives think about breach impact.
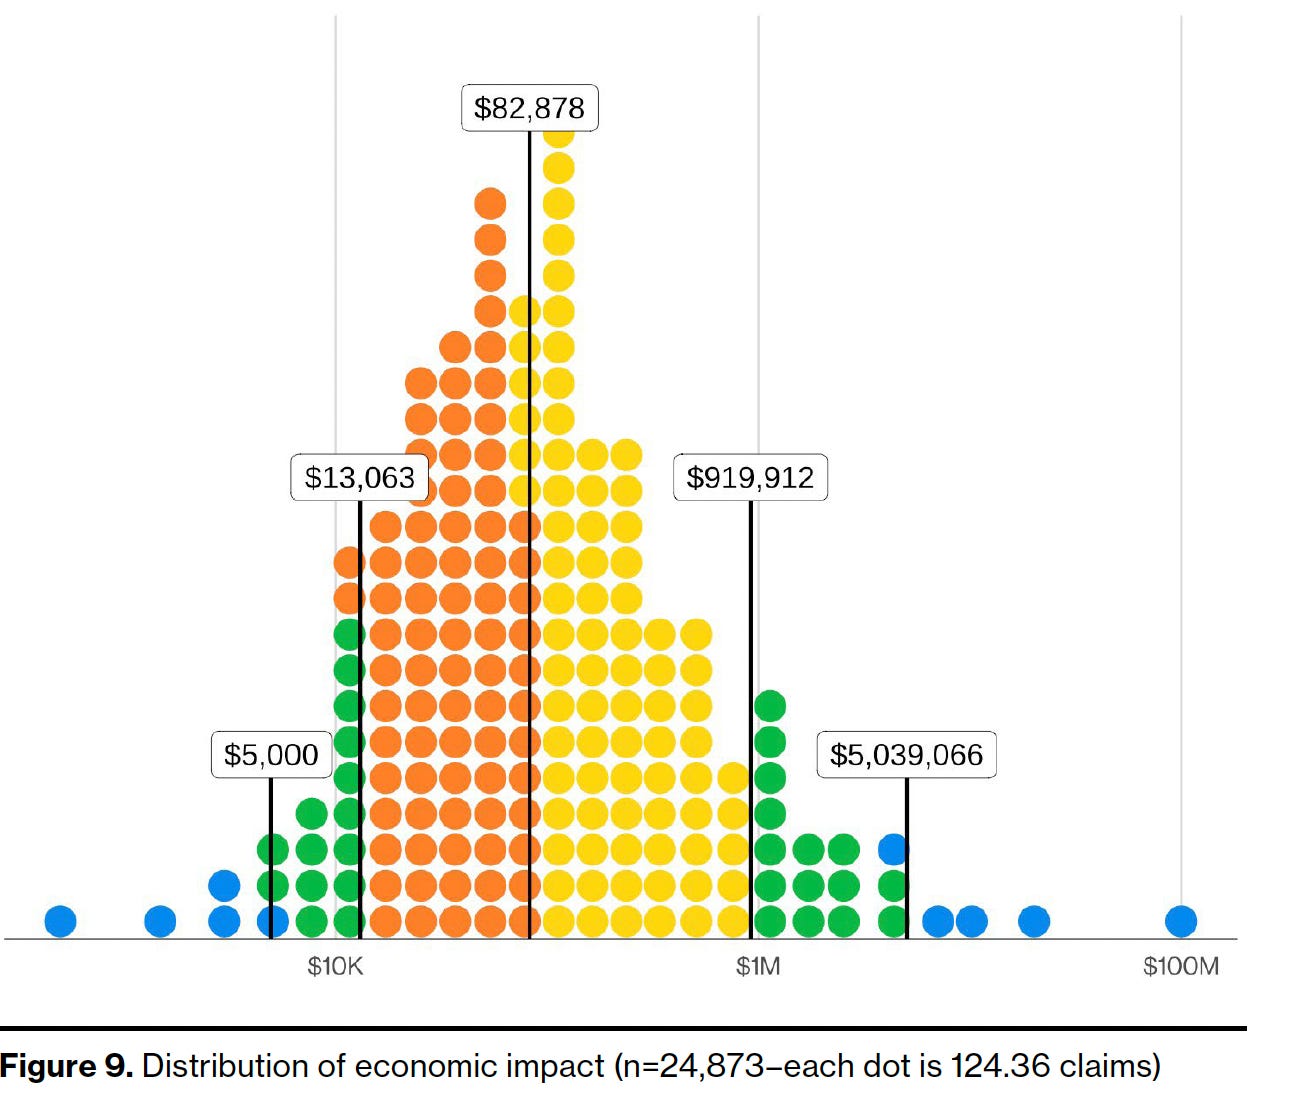
Half of all reviewed paid-out claims had a financial impact greater than $83,000. That is the median, the top 10% exceeded $920,000, and the most extreme cases, the top 2.5% of the dataset, surpassed $5 million in insured losses. For every 100 organizations that file a claim, approximately 50 face losses under $83,000, 10 face losses exceeding $920,000, and two to three face losses exceeding $5 million.
Those numbers matter because they replace the single-average-figure approach that has distorted risk conversations for years. The BIS authors deliberately chose medians over averages because averages are easily distorted by outliers. They also published the full distribution, which means organizations can finally position themselves against actual percentile outcomes rather than a single number that applies to no one.
The Costs Are Rising, and It’s Not Just Inflation
Segmenting the data by year reveals a trend that should concern any practitioner focused on long-term risk modeling and helps demonstrate the changes in terms of breach impact costs over time.. The median impact almost doubled from 2019 to 2024, rising from roughly $60,000 to roughly $110,000, that is an 80% increase. The top 10% impact went from around $435,000 to around $1.05 million. The top 2.5% went from around $2.44 million to around $5.14 million, more than doubling.
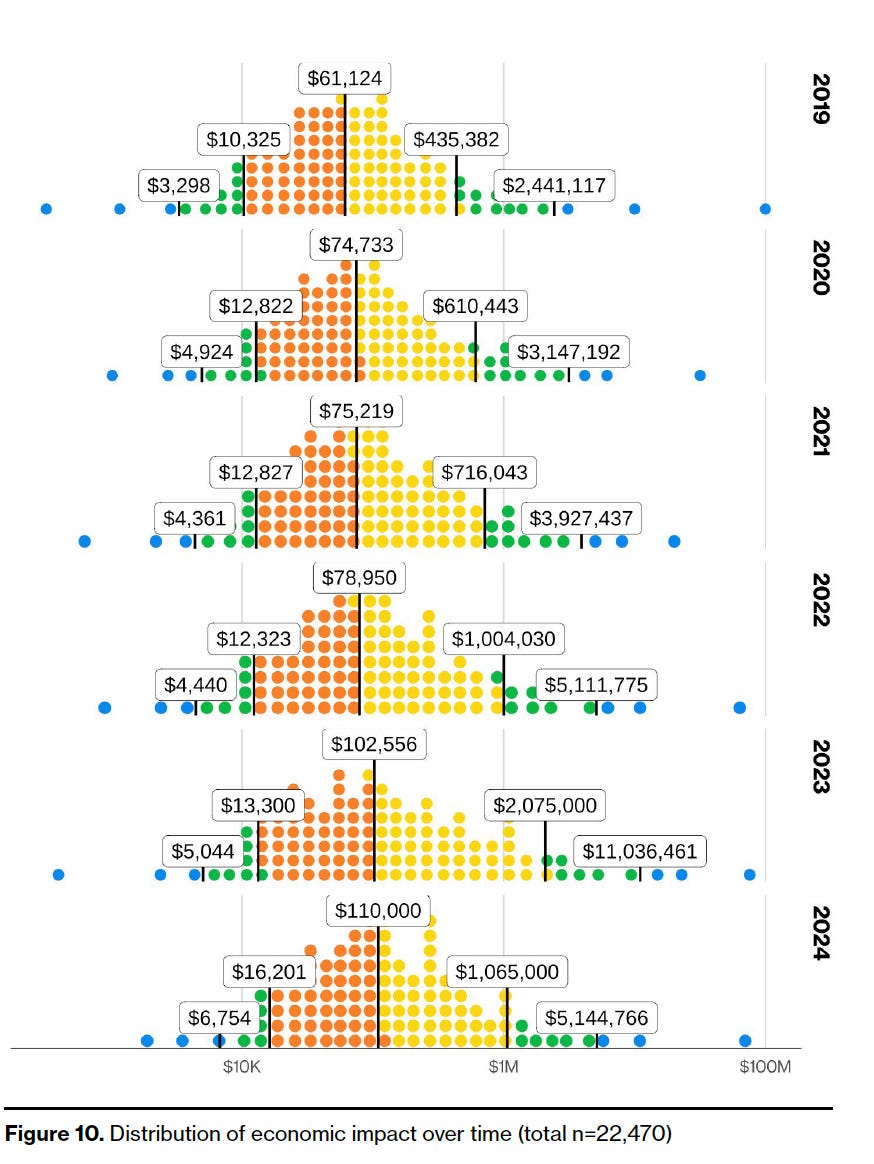
The Consumer Price Index inflation in the United States over the same period was around 23%. Breach costs grew at more than three times that rate. This is real growth in breach impact, not a statistical artifact of inflation. Breaches are genuinely becoming more expensive, driven by the growth of ransomware, the increasing complexity of incident response, and the expanding regulatory environment that creates downstream liability.
The 2023 data is particularly striking, because the BIS team found a significant spike in the top 10% and extreme impact tiers that year, driven by a surge of zero-day vulnerabilities that supported widespread ransomware campaigns. Many organizations were caught unprepared, and the insurance data suggests that unpreparedness translated directly into higher financial impact.
It will be interesting to see how the industrialization of vulnerability discovery and autonomous exploitation, which I have been writing about a lot lately, shows up in future breach impact data, if at all. While it isn’t widespread yet, I anticipate that may change in coming years as AI is democratizing destructive behavior for malicious actors, and enhancing the capabilities of those.
Size Matters, But Not the Way You Think
The BIS segments organizations into three revenue brackets: SMBs with revenue under $25 million, mid-market businesses between $25 million and $250 million, and large enterprises above $250 million.
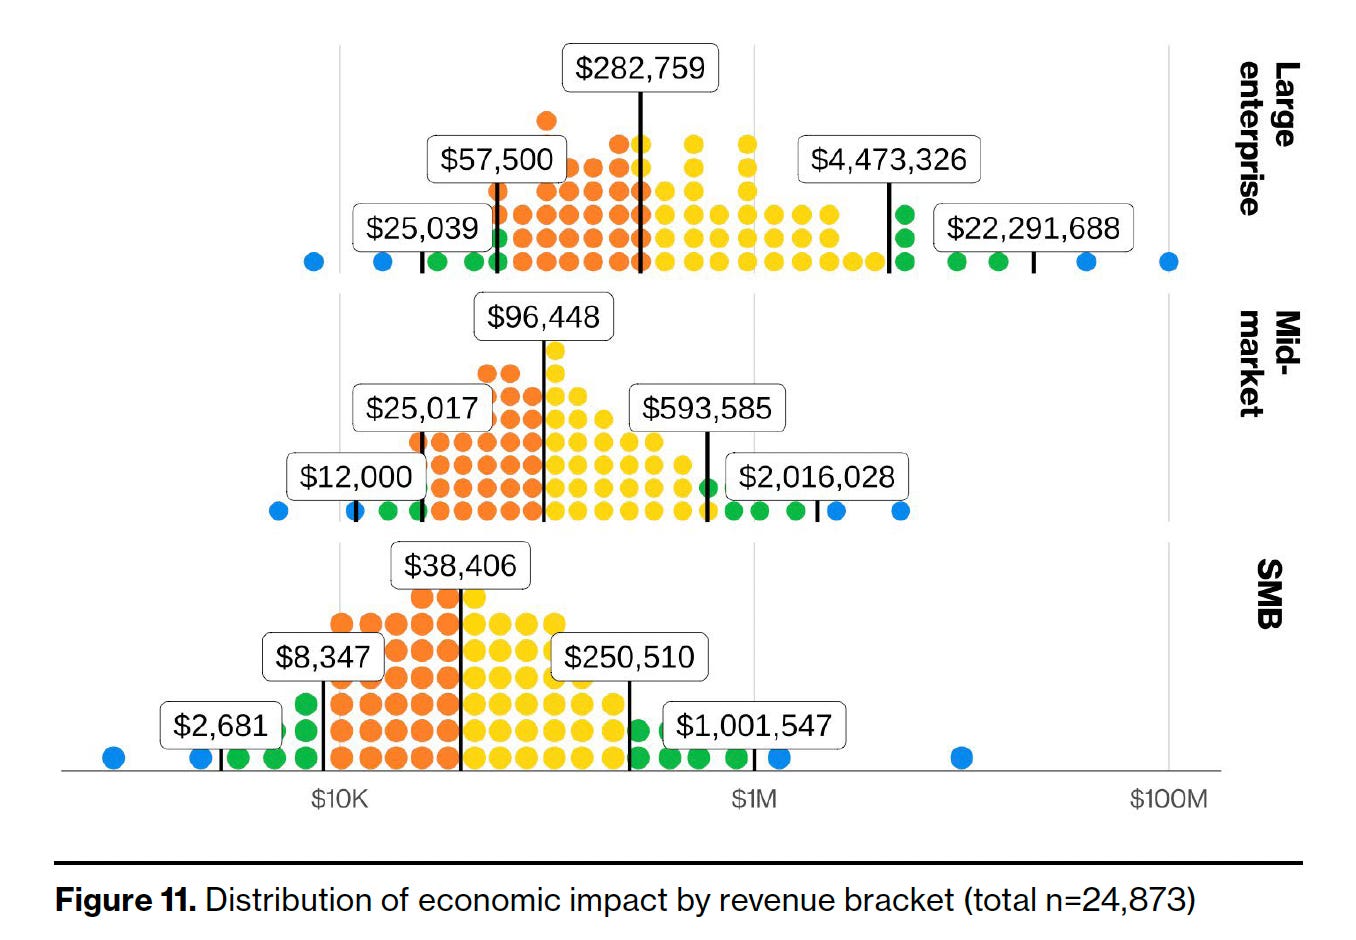
The absolute dollar amounts scale predictably with size. The SMB median is approximately $38,000, the mid-market median almost triples to roughly $96,000. Large enterprise jumps more than seven times higher to around $283,000. At the extreme end, the top 2.5% of large enterprise claims exceeded $22 million per claim, which is 22 times larger than the same percentile for SMBs.
But the ratio to revenue tells a different story. For SMBs, breach impact reached as high as 3% of revenue in the top 10% of cases and over 7% in the most extreme 2.5%. For mid-market and large enterprises, that ratio never exceeded 2%, even in the worst cases. SMBs face a disproportionate burden relative to their ability to absorb it, which matters because these are exactly the organizations with fewer resources to invest in prevention and recovery.
This is the textbook example of the cybersecurity poverty line popularized by Wendy Nather, and something my friend Ross Haleliuk and I have written about in a piece titled “Lifting the World Out of Cybersecurity Poverty”. These SMBs have far less expertise and financial resources yet suffer significantly more financially from incidents than their large counterparts.
I touched on some of these systemic struggles with Wendy herself and Casey Ellis in a past issue of Resilient Cyber:
Where the Money Actually Goes
The BIS breaks insured losses into four categories that the authors call the “4Ls” of breach impact.
Loss to threat actor includes direct payments like ransom and funds stolen through fraud.
Loss due to business interruption covers both the organization’s own downtime and contingent interruption from third-party outages.
Loss due to response and recovery captures incident response and data restoration costs.
Loss due to external liability includes regulatory penalties, PCI fines, and lawsuit settlements.
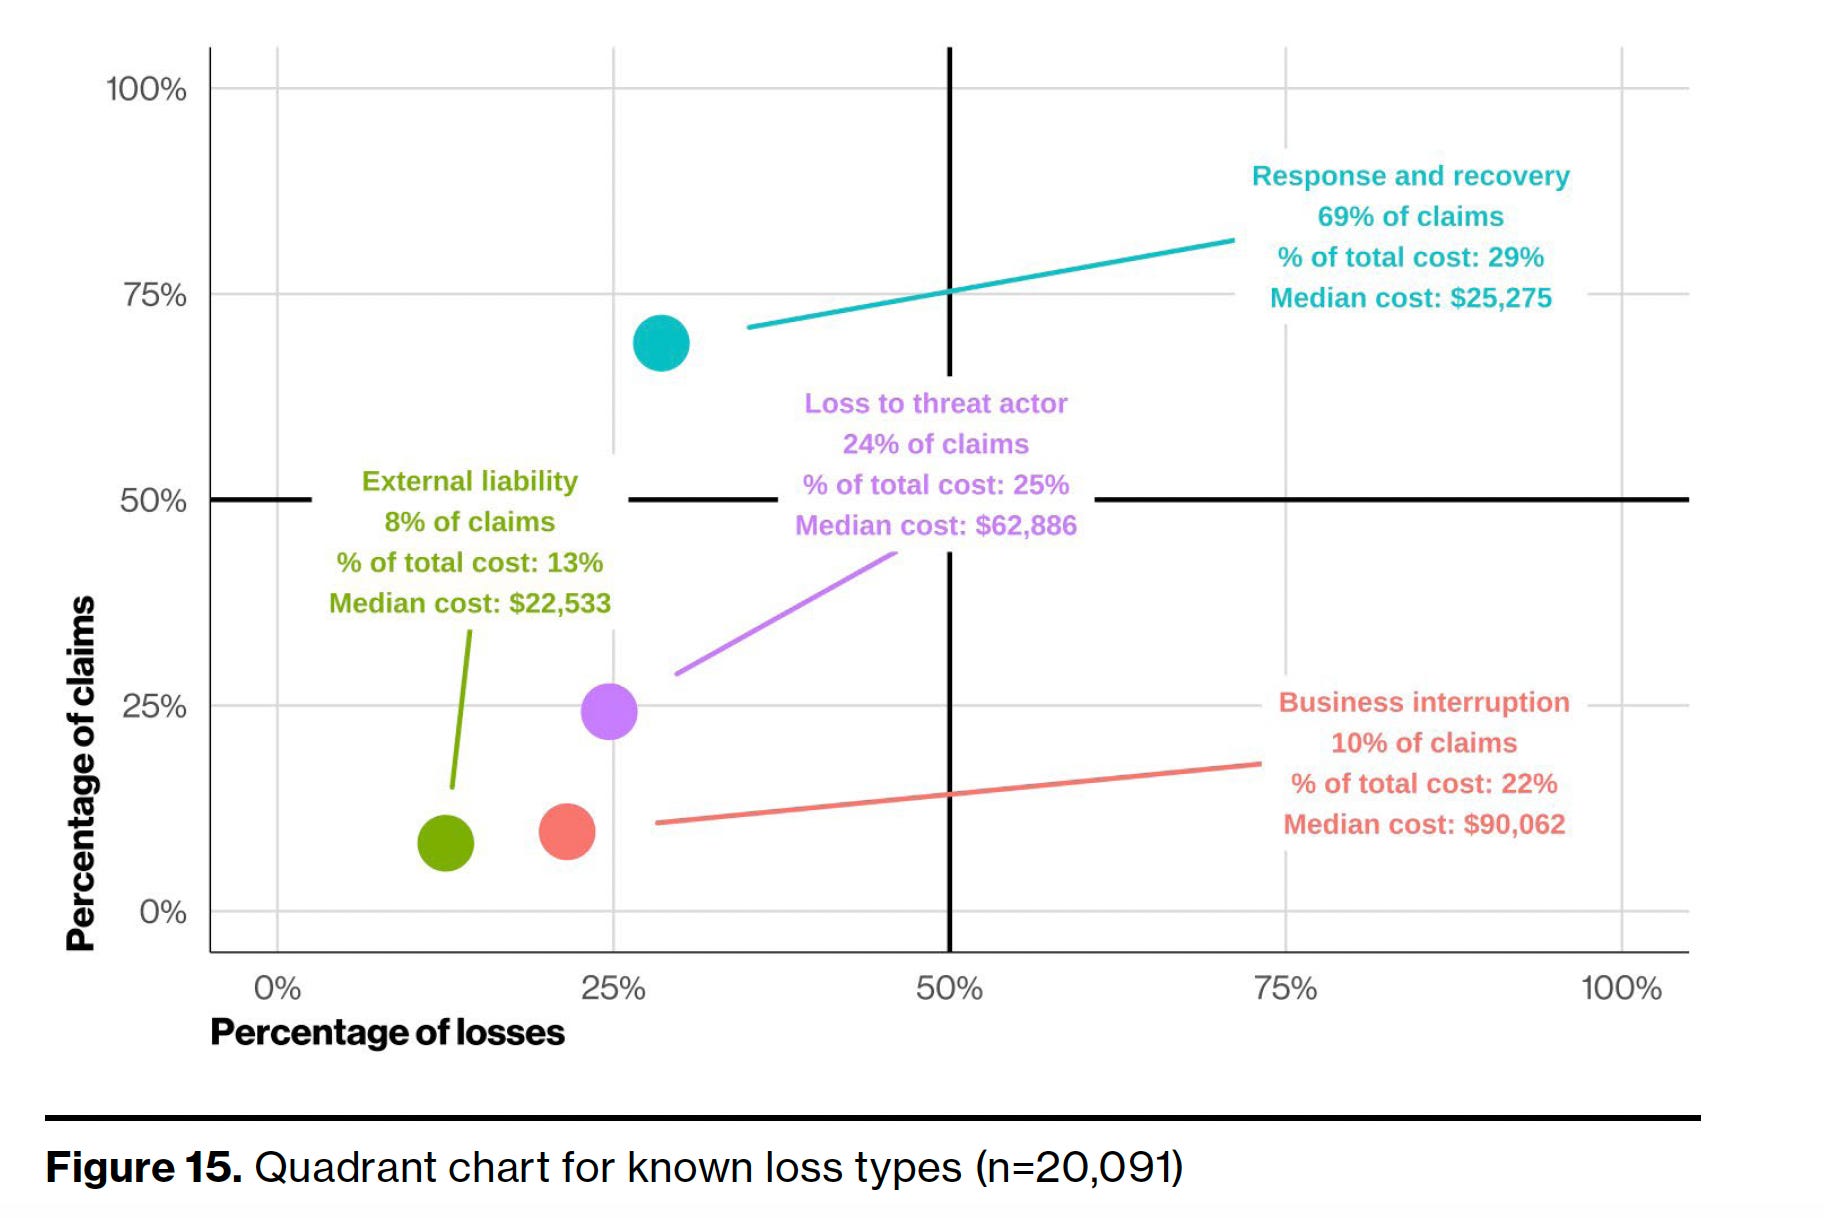
The distribution across these categories challenges some common assumptions.
Response and recovery shows up in 69% of claims but represents only 29% of total losses, with a median cost of $25,275.
Loss to threat actor appears in 24% of claims and accounts for 25% of total losses, with a median of $62,886.
Business interruption appears in only about 10% of claims but accounts for a disproportionate 22% of overall costs, with the highest median of any category at $90,000 and extreme cases reaching nearly $5 million.
The growth of business interruption is the trend most practitioners should be watching.
Its share of known losses grew 51% in just one year, from 21% in 2023 to 32% in 2024. In 2024, the dataset also began tracking contingent business interruption separately, meaning downtime caused by a third-party outage rather than a direct attack. That category represented 13% of all known loss types in its debut year. Across all years, business interruption as a whole accounted for 50% of total known loss amounts in supply chain or third-party incidents.
This is the financial evidence for something practitioners have been saying for years. Third-party risk is not just a compliance checkbox. It is a material financial exposure that shows up in real claims data.
This data also emphasizes why security can be a friction point and problematic in some cases. Organizations are rightfully reluctant to disrupt business operations to address security issues (e.g. patching) in some cases, and the last thing security wants to do is violate the A of the CIA triad ourselves.
Ransomware’s Outsized Economics
Ransomware accounts for 36% of claims in the BIS dataset but 73% of total insured costs, with a median impact of $303,547. That is more than three and a half times the overall dataset median. The BIS quadrant chart captures this disparity cleanly, showing ransomware in the upper-right quadrant, meaning it is both common and expensive.
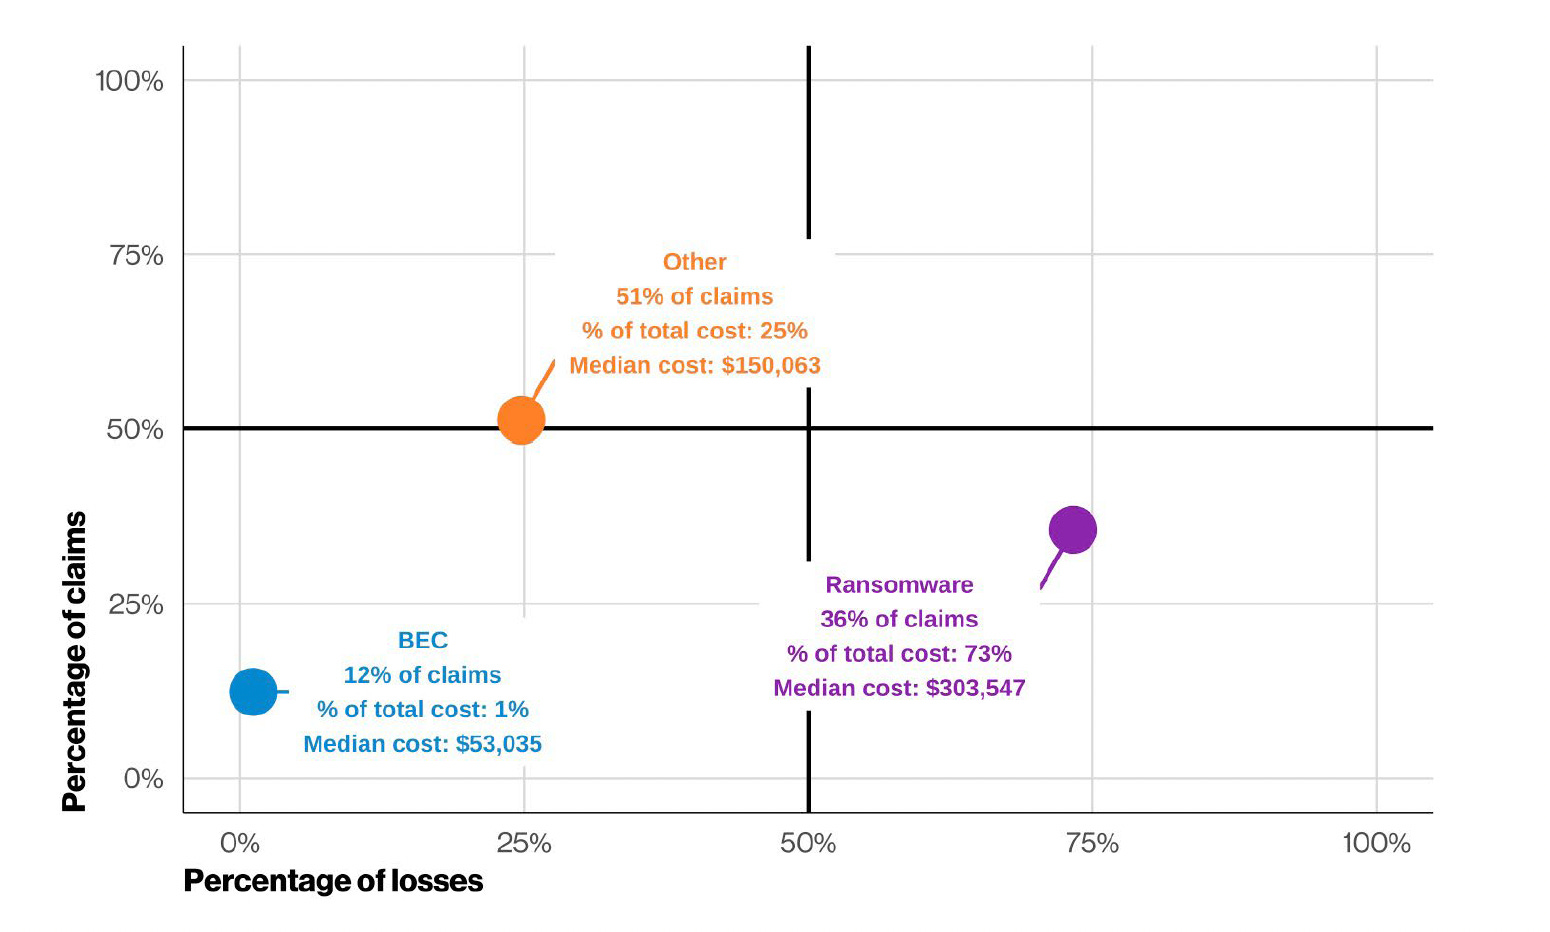
BEC, by contrast, shows up in 12% of claims but represents only 1% of total cost, with a median of $53,035. BEC is common but comparatively cheap, ransomware is common and devastating.
The BIS also reveals that 69% of ransomware victims did not end up paying the ransom, aligning with findings from the 2026 DBIR that the percentage of victims choosing not to pay has been growing since at least 2022, and 48% of ransomware claims had no data restoration and no extortion claims at all, suggesting that in many cases, the threat actors either failed to encrypt systems successfully or the organizations chose not to engage.
Organizations Don’t Die From Breaches
Here is where the conversation gets uncomfortable for cybersecurity professionals, myself included, given in our hearts we want the data to help support our desire for businesses to take cyber more seriously, invest more, and treat it as more of a priority.
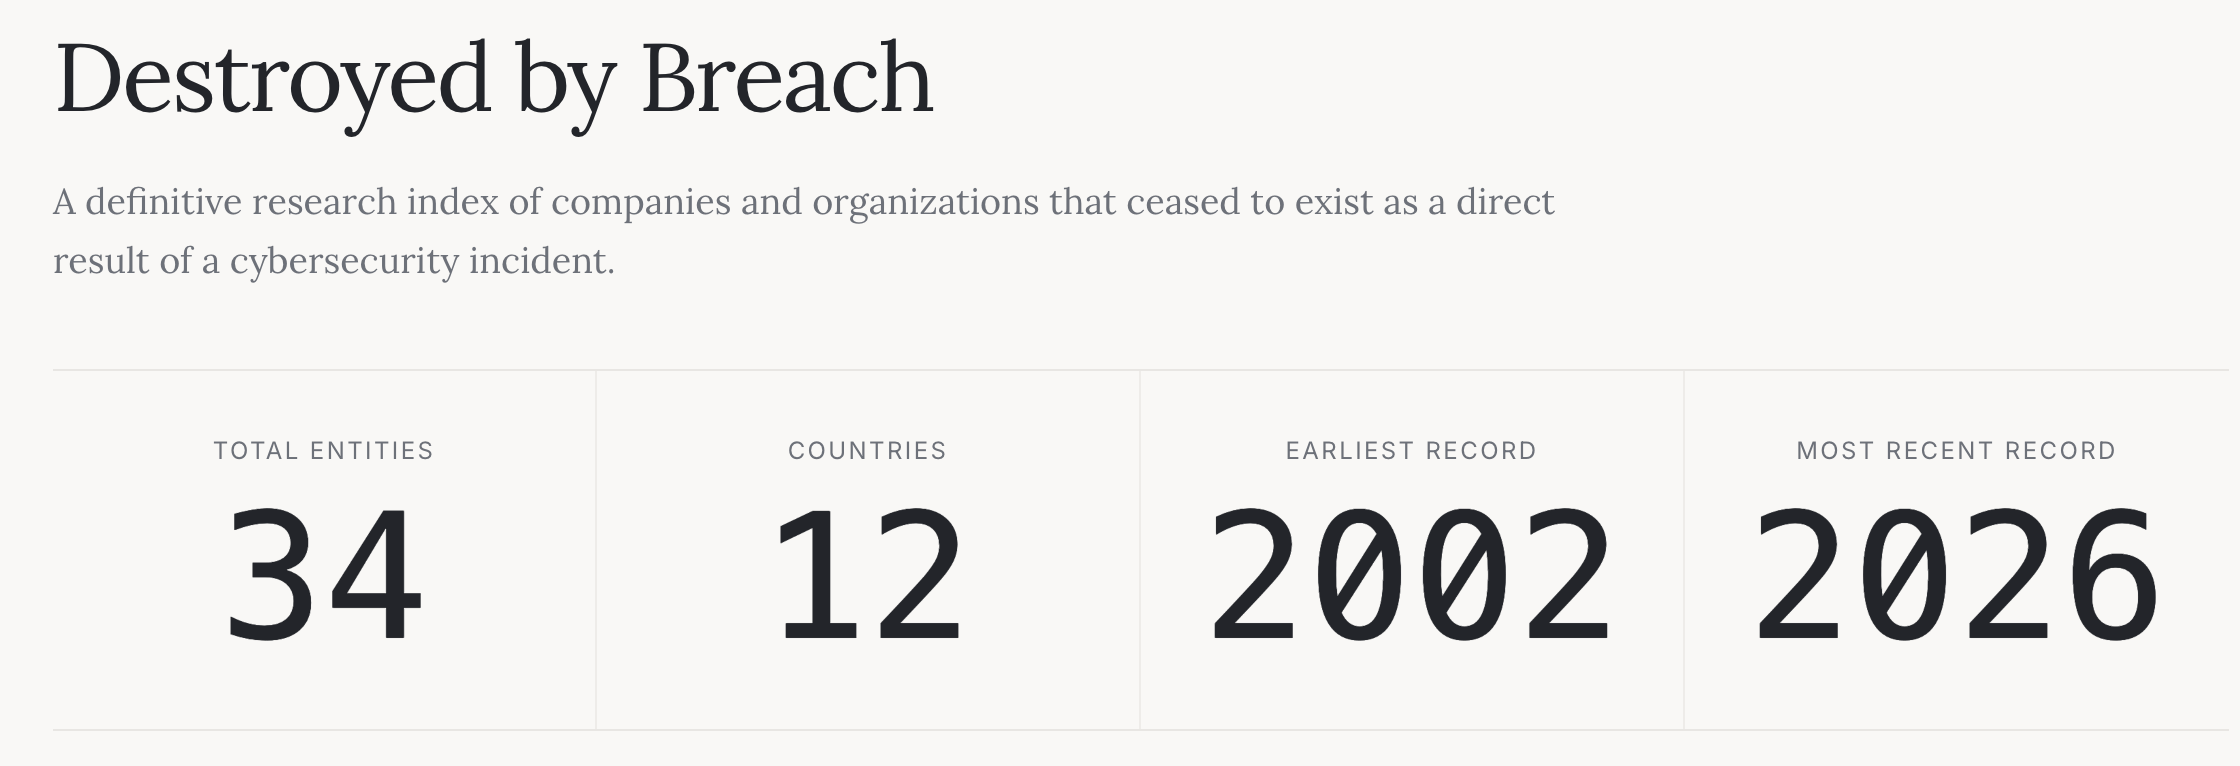
Adrian Sanabria has spent years curating destroyedbybreach.com, a searchable database of companies that actually ceased to exist as a direct result of a cybersecurity incident.
After roughly a decade of research, he has found only about 25 to 32 companies that meet that criteria. Given the thousands of breaches that occur every year, that is a remarkably small number.
The widely recycled statistic that “60% of small businesses go out of business within six months of being hacked” has no traceable original source and no credible evidence behind it.
As we discussed above, SMB’s do indeed face outsized financial impacts, but that rarely leads to them actually going out of business due to a material cyber incident.
The companies that did collapse shared a common pattern. The breach was the trigger, but not the root cause. These organizations lacked incident response plans, had no ability to contain damage, maintained no usable backups, and had no operational resilience. The breach exposed pre-existing organizational failures, it did not create them.
As I covered in Cybersecurity’s Delusion Problem, the cybersecurity industry has a tendency to overstate its centrality to business outcomes. Revenue, speed to market, market share, and competitive positioning rightfully take priority for most organizations. Microsoft has weathered multiple severe, high-profile security incidents and continues to grow in consumption, revenue, and market share.
The market sends a clear signal, and that signal is not “cybersecurity failures are existential.”
This is why many consider cybersecurity to be a market failure that won’t solve itself and will require regulation. That of course opens another debate about regulation vs. innovation and if the costs of incidents are working as intended and businesses are paying the costs they are willing to tolerate.
Kelly Shortridge made this case with empirical precision in Markets DGAF About Cybersecurity, citing two peer-reviewed studies presented at the Workshop on the Economics of Information Security.
One found no statistically significant stock impact from data breach announcements in European markets across any industry sector. The other found an insignificant relationship between trade secret theft and subsequent stock market performance, regardless of whether the attack was targeted, sophisticated, or conducted by nation-state actors.
The researchers concluded that it was difficult to support business cases for cybersecurity investment based on stock price impact alone.
Comparitech’s analysis of 118 publicly traded companies breached between 2007 and 2023 found that share prices bottomed out roughly 41 business days after breach disclosure, dropping an average of 1.4%, and recovered to pre-breach absolute levels within approximately 53 business days.
That figure gets cited frequently, but the context matters. Breached companies continued to underperform the NASDAQ by 3.2% after six months, 8.6% after one year, and 15.6% after three years. The stock price “recovers” in absolute terms, but investors in breached companies still do worse than the broader market over time. The damage is real, it just is not the company-killing event the industry has been selling.
But the Risk Is Real
None of this means cybersecurity does not matter and the BIS data makes that clear in several important ways.
The median breach costs $83,000, but the distribution has a long tail. Two to three out of every 100 claimants face losses exceeding $5 million. For SMBs, those costs can represent 7% of annual revenue. Supply chain incidents carry a median cost more than double the overall dataset at $252,666, with the extreme top 2.5% exceeding $100 million.
These are insured losses only, meaning they represent the floor of actual economic impact, not the ceiling.
External liability adds another dimension that matters enormously when regulation is involved. Liability costs appear in only 6.4% of total claims, but the median loss is around $22,000 and the extreme cases exceed $4.1 million.
Healthcare organizations face liability costs 57% higher than the overall median. The Retail sector saw the highest rate of liability losses at approximately 18% of cases, and because third-party liability claims often involve long settlement timelines, the BIS authors note that their dataset likely undercounts the true frequency and magnitude of these costs.
Manufacturing faces its own disproportionate burden. Business interruption losses in manufacturing carry a median 158% higher than the overall dataset and account for 30% of all losses in that sector. When production stops, the financial clock runs fast., and I feel this represents the differences between the physical and digital realms.
The BIS data tells a story consistent with what risk practitioners already know. Cyber risk is a real financial exposure. It follows a distribution with a fat tail.
Organizations should be asking themselves whether their current risk models and insurance coverage account for the actual distribution of outcomes, including the tail scenarios where losses reach seven and eight figures.
What This Data Should Change
The BIS represents a significant step forward for an industry that has historically operated on vibes, vendor-sponsored surveys, and recycled statistics of questionable provenance coupled with marketing hype and FUD to try and dive spending.
This is a great large-scale, claims-backed dataset that tells us what breaches cost across different organization sizes, industries, incident types, and loss categories.
The implications cut in both directions.
Practitioners who have been selling cybersecurity as existential risk need to reckon with the evidence that organizations overwhelmingly survive breaches and that markets absorb cyber events without the catastrophic consequences the industry has promised.
At the same time, practitioners who dismiss cyber risk as immaterial need to reckon with the fat-tailed distribution, the real year-over-year growth in impact that outpaces inflation by a factor of three, and the increasingly material role of business interruption and regulatory liability.
The BIS data does not support the FUD narrative, but it does not support complacency either.
It supports something the cybersecurity industry has always struggled with, which is proportion. Knowing that the median ransomware claim costs $303,547 and that business interruption grew from 21% to 32% of known losses in a single year is more actionable than any scare statistic about “the average cost of a data breach.”
Knowing that SMBs face a 7% revenue impact in the worst cases while large enterprises rarely exceed 2% tells you something specific about where to focus resources and coverage. Ironically, most startups target large enterprises, those with the resources and expertise to face less of an impact than SMB’s, and they do it rightfully so because that is where the budget to purchase cutting edge software and innovative solutions resides, along with the big logos startups need to justify market momentum and continued investment from VC’s.
The best risk decisions come from the best data. The BIS gives us better data than we have ever had. It remains to be seen if the industry will use it to have honest conversations about proportionate risk, or whether it will cherry-pick the scariest numbers and continue the cycle of FUD that has defined cybersecurity marketing for decades.
I know which one I would bet on, but I also know which one I will keep advocating for.